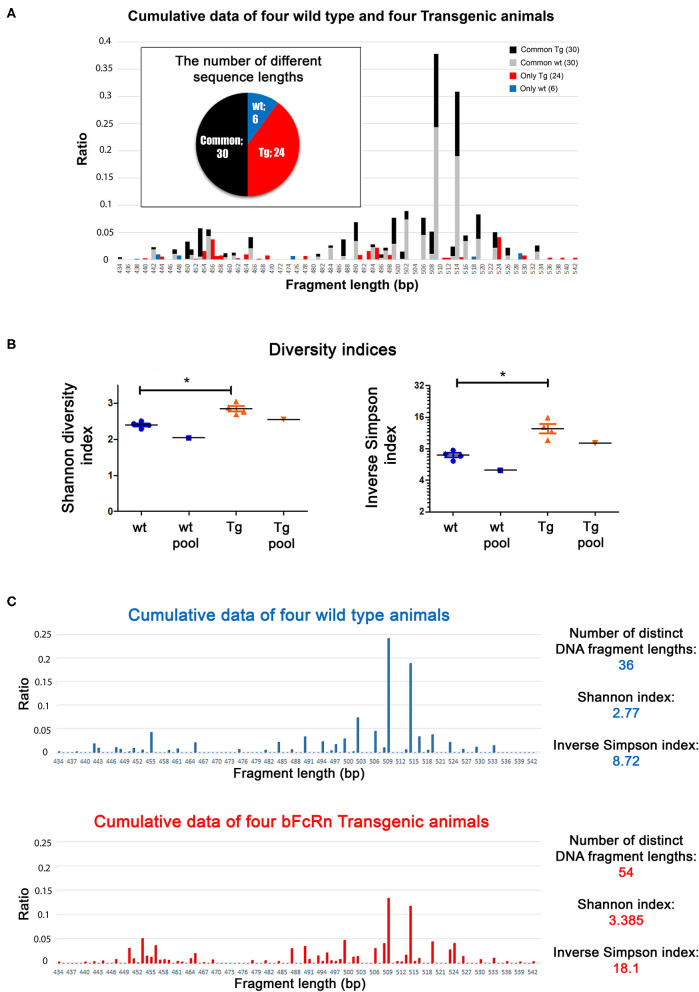
Figure 2.
Length distribution analysis of the variable regions of the Tg and wt mice. The animals were immunized with OVA and were sacrificed on day 24. (A) Data from 4 wt and 4 Tg animals were summarized and illustrated in one graph. The Tg animals contained sequences with more distinct lengths (pie chart: 24 unique + 30 common = 54 Tg altogether vs. 6 unique + 30) common = 36 wt altogether (common: it was found in the wt and Tg samples as well) and their sequence length distribution was more even (bar chart). Sequence lengths unique to either wt or Tg mice are illustrated in blue and red, respectively. (B) Diversity indices (Shannon, Inverse Simpson) for wt and Tg samples. Horizontal black lines and colored error bars represent the mean ± SEM of the data. Individual points correspond to specific animals. Pooled columns represent results obtained when pooling samples at cDNA level. Differences between mean values were tested using Mann-Whitney test. Statistically significant results are marked with asterisks (*p < 0.05). (C) Length distribution analysis of the variable regions of Tg and wt mice, where the data from 4 wt and 4 Tg animals are illustrated in two individual graphs.

