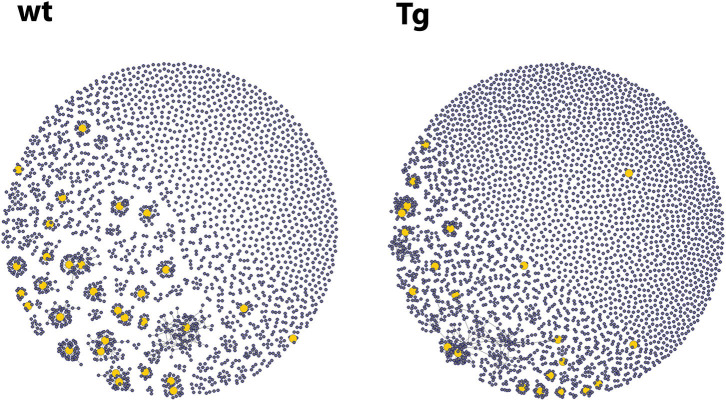
Figure 4.
Representative graphs from the network analysis of the repertoires of CD138+ plasma cells after OVA immunization. Each vertex of the graph represents a single sequence with a link (edges) to those sequences that did not differ from it in more than one nucleotide. Vertex size corresponds to the number of identical sequences found. The yellow vertices represent highly expanded clones (each harboring at least 0.5% of the sequences). The Tg animals contained more clusters (mean: 2,229 vs. 1,347), which suggests that more naïve B cell clones were activated in them upon immunization. The graphs were prepared using the igraph R package.

