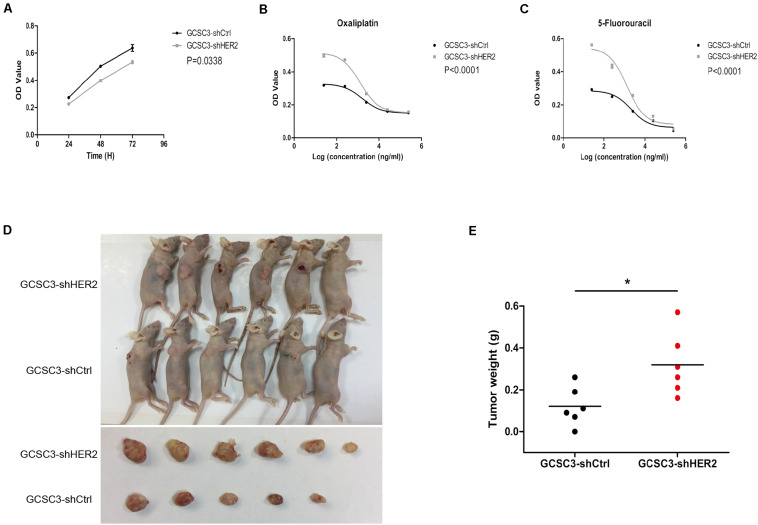
FIGURE 4.
The results of CCK-8 assay, chemotherapy sensitivity, and xenograft models of GCSCs. Picture (A) shows that down-regulation of HER2 could decrease the proliferation of GCSCs (p = 0.0338). Data were expressed as mean ± SEM. Pictures (B,C) show that the chemotherapy sensitivity for oxaliplatin and 5-fluorouracil was increased after HER2 interference (p < 0.0001). Pictures (D,E) show that tumor weight in the GCSC3-shCtrl group was significantly lower than that in the GCSC3-shHER2 group (0.12 ± 0.04 g vs. 0.32 ± 0.06 g, p = 0.0192), *p < 0.05.

