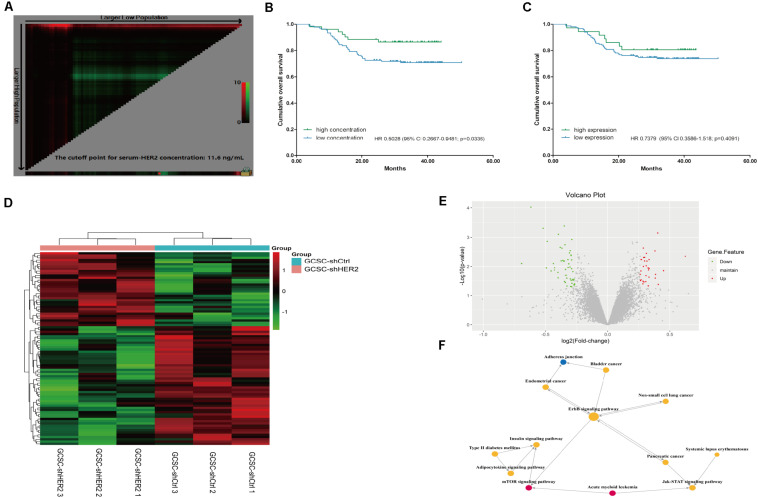
FIGURE 5.
Survival analyses and results of gene microarray and signaling pathway analysis. Picture (A) X-tile plots for serum concentration of HER2 in our study; the red spot shows the cutoff value (11.6 ng/ml) that separates the cohort into two groups. Picture (B) Survival analyses of patients with different serum concentrations of HER2; the result indicated that patients with high concentration of HER2 in serum had a favorable prognosis (p = 0.0336). Picture (C) Survival analyses of patients with different expression levels of HER2 in tumor tissue (p = 0.4091). Picture (D) Heatmap representation of the gene expression profiles of HER2-interfered GCSCs and control cells. Up-regulated expressions are marked in red; down-regulations are colored green; black reflects no difference in expression levels. Picture (E) The volcano plot of the gene microarray is used to evaluate the overall distribution of the differential gene between the HER2-interfered GCSCs and control cells. Green plots represent down-regulation mRNA genes while red plots represent up-regulation mRNA genes with a fold change > 1.2 and p value < 0.05. Picture (F) Signaling pathway analysis revealed that HER2 gene might regulate the signal transduction of mTOR, Jak-STAT, and other signal pathways. Yellow circles represent pathways with up-regulation and down-regulation mRNA genes. Pathways that only contain up-regulation mRNA genes were marked with a red circle, while the blue one represents pathway that involves down-regulation mRNA genes. The size of circles shows the value of degree.

