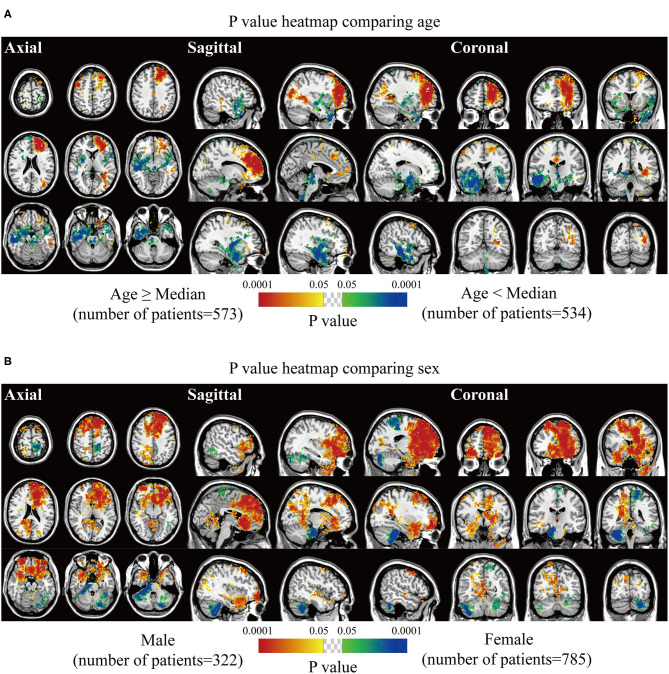
Figure 3.
p-value heatmaps of meningioma comparing age and sex. (A) p-value heatmap showed statistically significant clusters after comparing older (age ≥ 56 years) with younger (age < 56 years) patients. (B) p-value heatmap showed statistically significant clusters after comparing male with female patients. The color ranging from green to dark blue, and bright yellow to red, both indicated the p-value from 0.05 to 0.0001.

