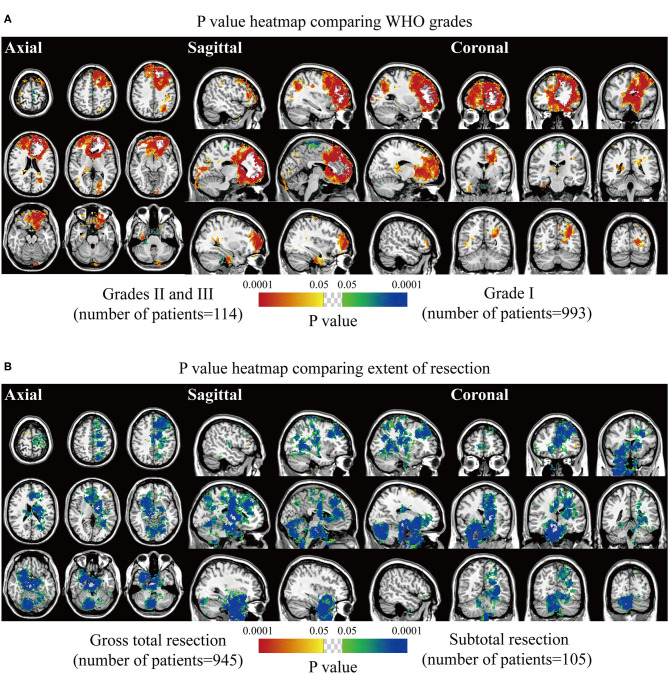
Figure 4.
p-value heatmaps of meningioma comparing WHO grade and extent of resection. (A) p-value heatmap showed statistically significant clusters after comparing grade I lesions with grades II and III ones. (B) p-value heatmap showed statistically significant clusters after comparing patients received gross total resection with ones received subtotal resection. The color ranging from green to dark blue, and bright yellow to red, both indicated the p-value from 0.05 to 0.0001.

