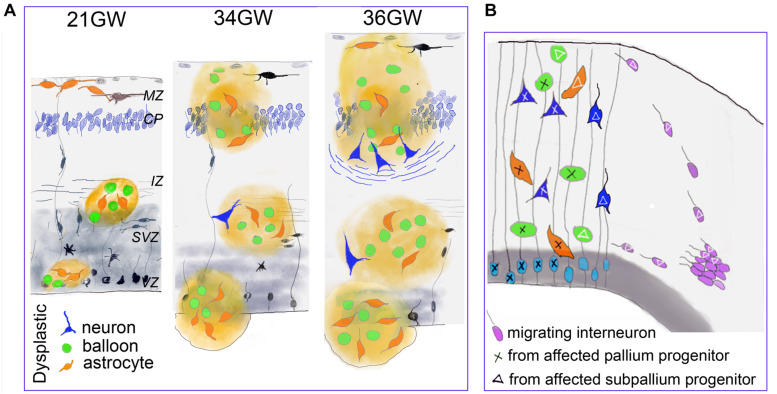
FIGURE 8.
Developmental changes of TSC lesions. (A) Schematic representation of the main changes observed in fetal TSC lesions. Dysmorphic cells are represented in green (Giant cells) orange (dysmorphic astrocytes) and blue (dysmorphic neurons). MZ, marginal zone; CP, cortical plate; IZ, intermediate zone; SVZ, subventricular zone; VZ, ventricular zone. (B) Schematic representations suggesting that TSC lesions would be mosaic and result for the development of two different neural progenitors: from pallium (light blue) and subpallium (violet). This hypothesis is supported by our data indicating that a subgroup of dysmorphic neurons and Giant cells express markers of GABA interneurons and that part of tuber cells would enter from the marginal zone. As only some cells display dysplastic features, we speculate that TSC mutation impact the developmental program of subset of cell lines (tagged with X or triangle).

