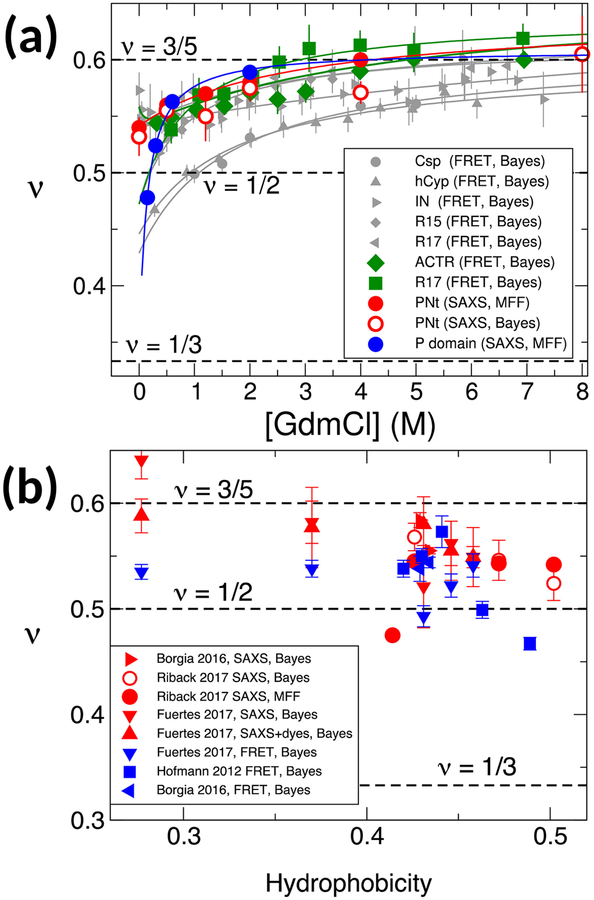
Figure 4:
Consistent analysis of multiple SAXS, FRET data sets. (a) Dependence of scaling exponent ν on denaturant concentration from SAXS data from Riback et al. [53] (red, blue symbols), and FRET data from Hofmann et al. [8] (grey symbols) and Borgia et al. [51] (green symbols). Analysis methods – Bayesian refinement or MFF – are given in legend in each case. (b) Dependence of scaling exponent on mean Kyte-Doolittle hydrophobicity for proteins studied by Borgia et al. [51], Fuertes et al. [52], Hofmann et al. [8] and Riback et al. [53]. Experimental methods and analysis methods are indicated in the legend.

