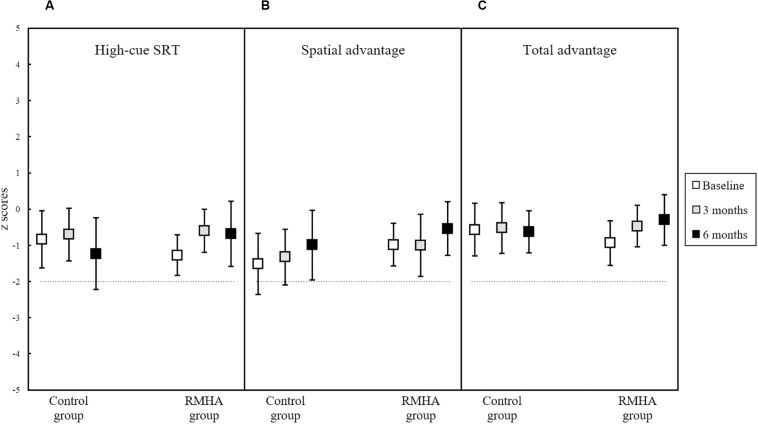
FIGURE 4.
Plots of mean z scores in (A) the High-cue SRT score, (B) the Spatial Advantage score, and (C) the Total Advantage score, for 13 controls and 12 RMHA children (and 13 controls and 13 RMHA children in the Spatial Advantage score only), at baseline, 3 months and at 6 months. Error bars represent a 95% CI of the mean. The horizontal dotted line indicates the cut-off for what is considered abnormal performance (i.e., −2 z scores and below). One participant had two outlying cases in post-intervention testing at 6 months in the High-cue SRT and Total Advantage scores. Outliers were removed, as the participant had decreased focus and interest and had difficulty remaining seated during the fourth and final test condition. This condition is used to calculate both the High-cue SRT and Total Advantage scores, and because it is the last condition it can indicate auditory fatigue or declining attention in the subject (National Acoustic Laboratories, 2010). Removal of this case resulted in a comparison of 13 controls against 12 RMHA children in the analyses of these two conditions. CI, Confidence Interval; LiSN-S, Listening in Spatialised Noise – Sentences; RMHA, Remote Microphone Hearing Aid; SRT, Speech Reception Threshold.

