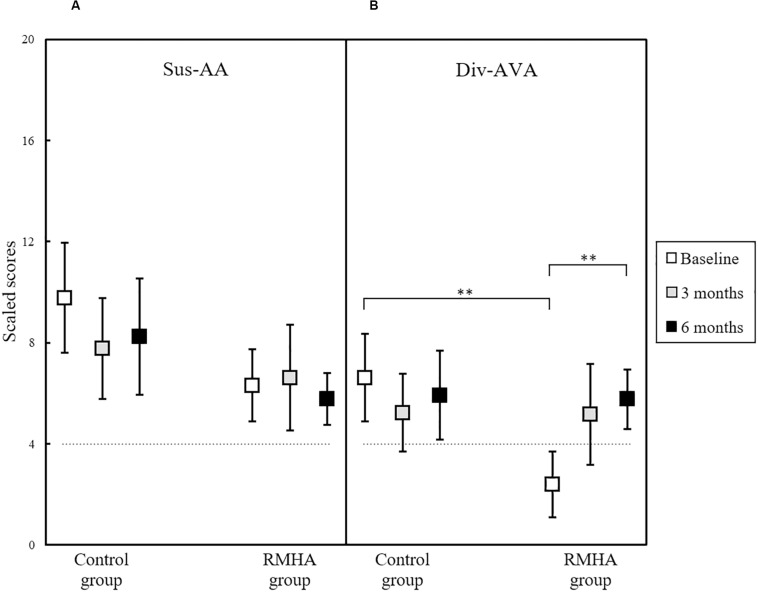
FIGURE 5.
Plots of mean scaled scores in (A) the TEACh Sus-AA subtest, and (B) the TEACh Div-AVA subtest, for 13 controls and 13 RMHA children, at baseline, 3 and 6 months. Error bars represent a 95% CI of the mean. There was a significant difference between the two groups in the Div-AVA baseline scores, and significant difference in the Div-AVA scores of the intervention group from baseline to 6 months. The horizontal dotted line indicates the cut-off for what is considered abnormal performance (i.e., 4 scaled scores and below). CI, Confidence Interval; Div-AVA, Divided Auditory-Visual Attention; RMHA, Remote Microphone Hearing Aid; Sus-AA, Sustained Auditory Attention; TEACh, Test of Everyday Attention for Children. ∗∗p < 0.01.

