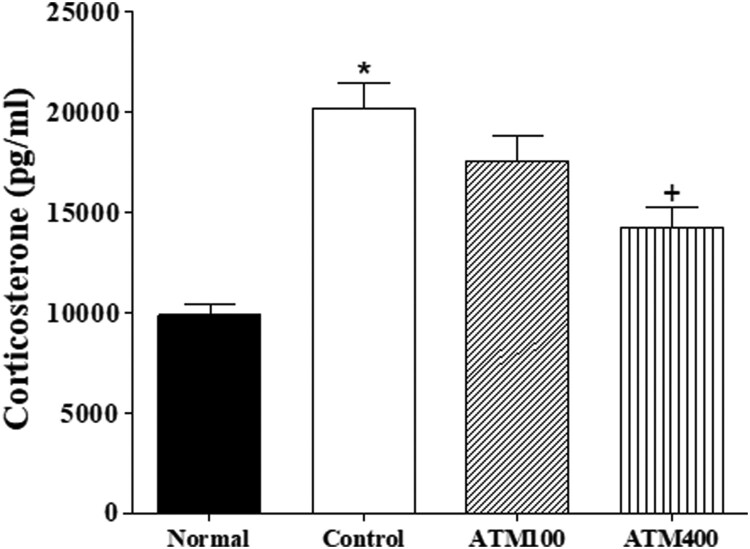
Figure 3.
The mean ± standard error of the mean (SEM) values of corticosterone in the serum. Note: The ELISA results were analyzed by performing separate one-way ANOVA of mean counts among the groups. Each value represents the mean ± SEM. *P < 0.05 compared with normal and +P < 0.05 compared with control

