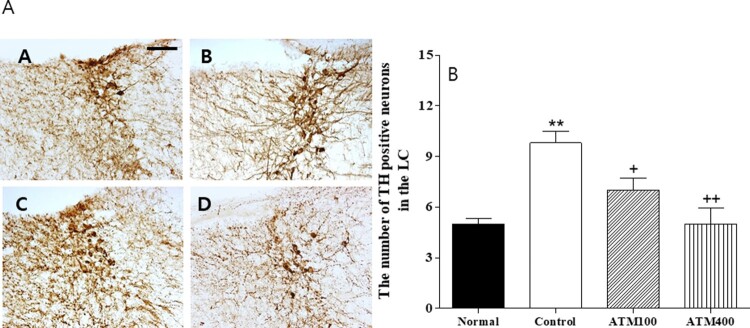
Figure 5.
A: The mean ± standard error of the mean (SEM) values of quantities of tyrosine hydroxylase (TH)–immunostained nuclei in the locus coeruleus (LC) of the experimental groups B: Photographs showing the distribution of c-Fos–immunoreactive cells in the LC of the (A) normal group, (B) control group, (C) ATM100 group, and (D) ATM400 group. Coronal sections were 30 μm thick, and the scale bar represents 50 μm (100 × 100). Note: The immunohistochemistry results were analyzed by performing separate one-way ANOVA of mean counts among the groups. Each value represents the mean ± SEM. **P < 0.01 compared with normal and +P < 0.05, ++P < 0.01 compared with control.

