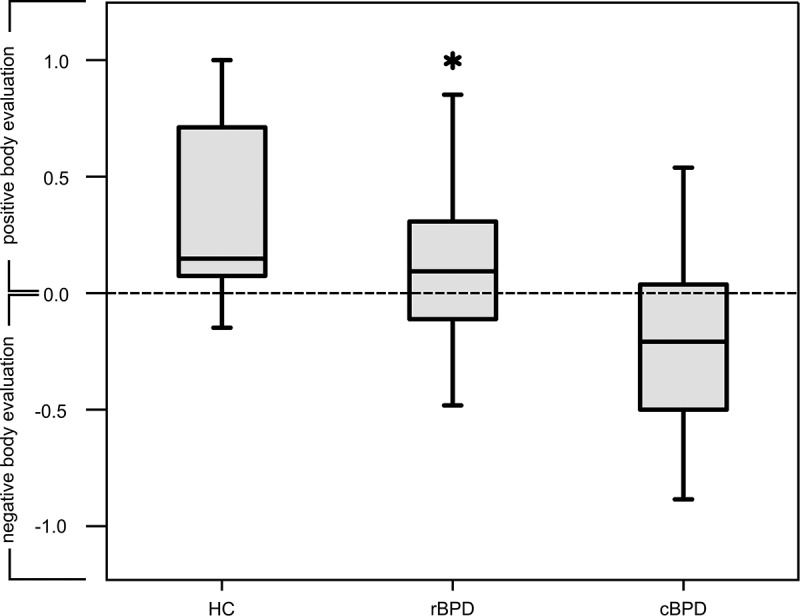
Figure 2.

Box plots for the evaluation of the own body in the three diagnostic groups. HC = healthy controls, rBPD = remitted borderline personality disorder, cBPD = current borderline personality disorder. Values range from −1 (= 100% negative) to +1 (= 100% positive). Outliers are marked by an asterisk.
