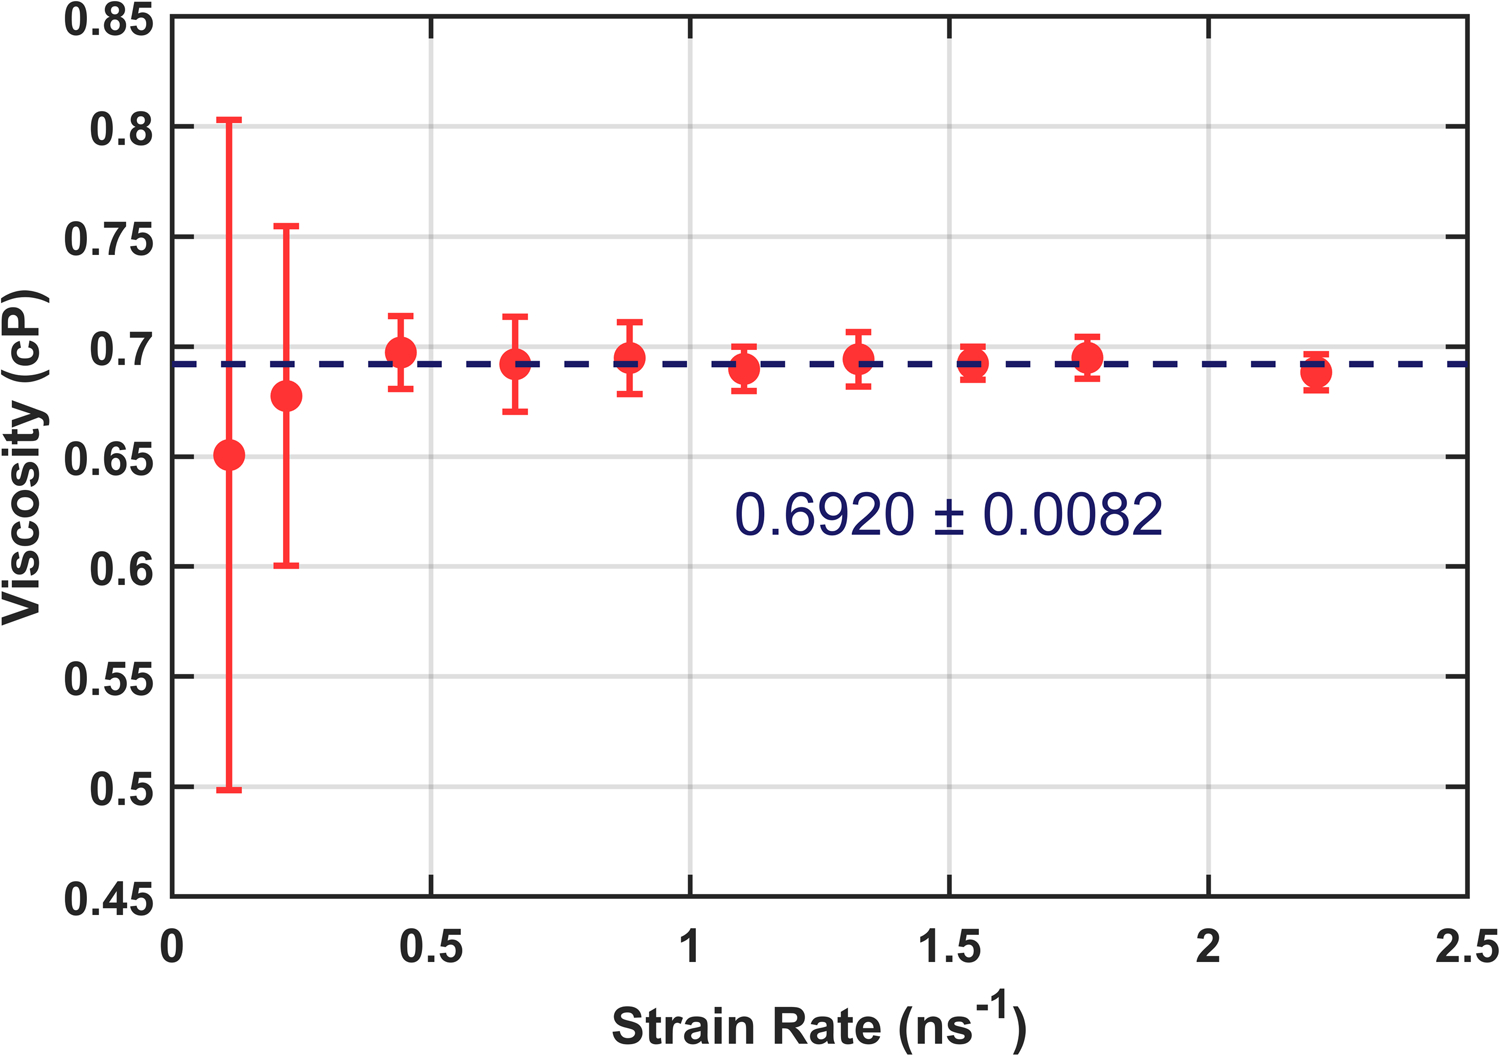
Figure 2:

Martini water viscosity as a function of strain rate. Each data point is the average of three 400 ns trials with error bars giving the standard error computed from each set of three trials. The dashed line indicates an inverse-variance weighted average of the data. (see SI for more details)
