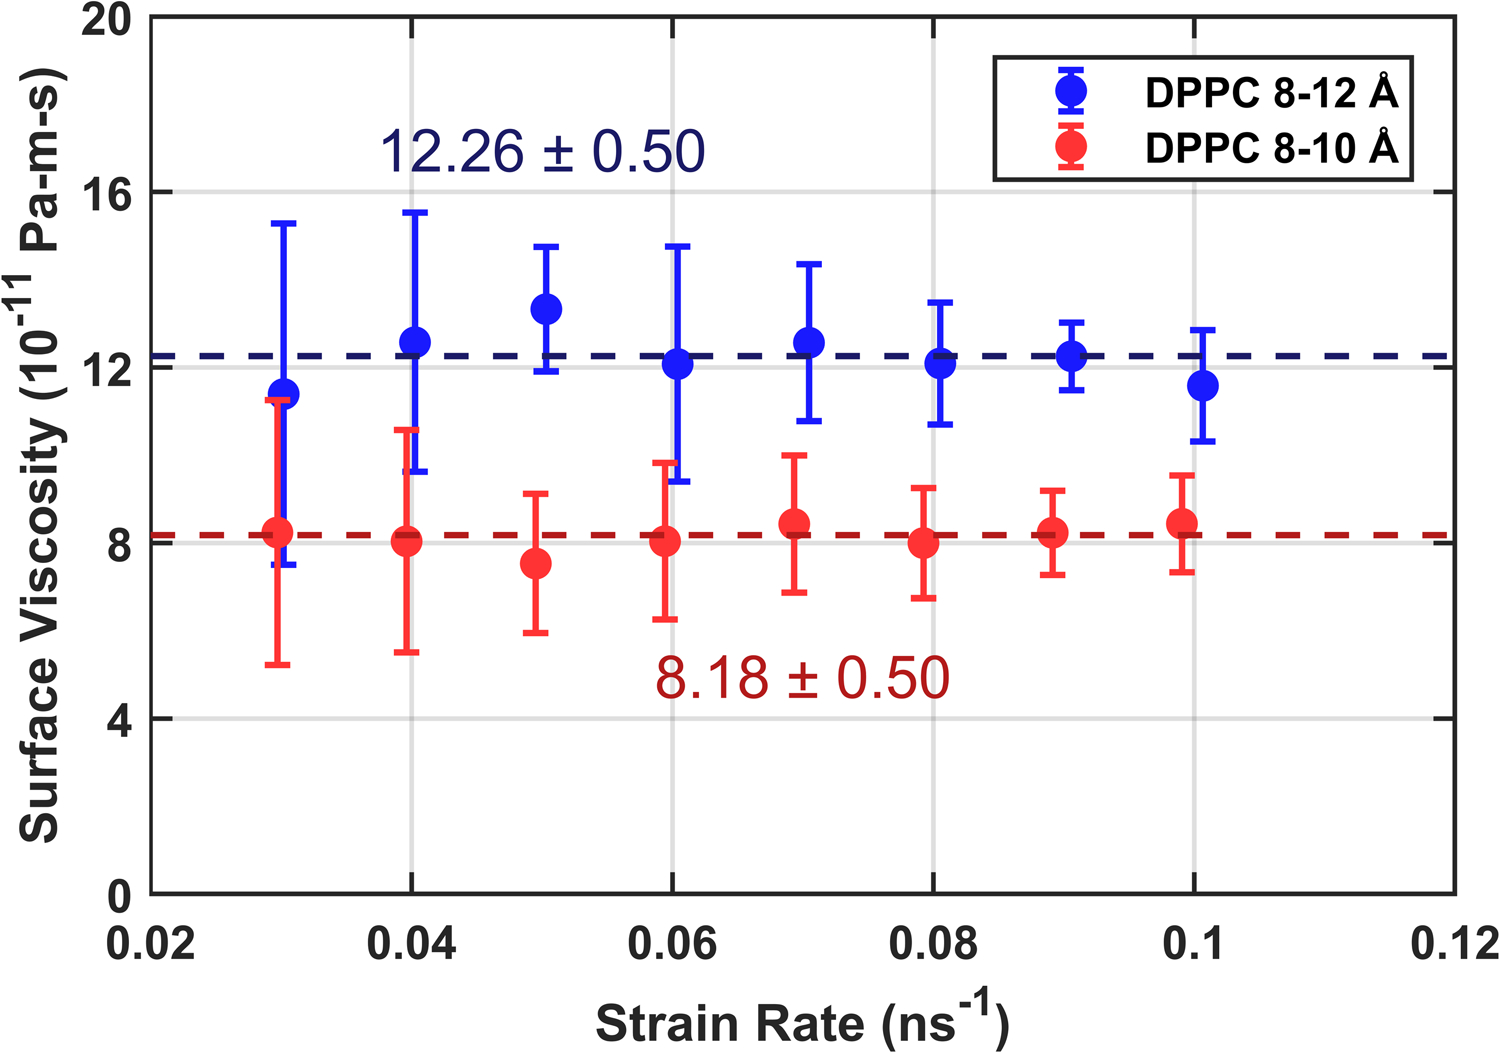
Figure 8:

Surface viscosity as a function of strain rate for C36 DPPC using two cutoff treatments: standard 8–12 Å force switching and the 8–10 Å force switching that yields the most accurate area per lipid with the simulation protocol used here. Both series were equilibrated independently to zero surface tension before shearing. Dotted lines show the result of taking inverse-variance weighted averages for each series. Each data point is the average of five trials at the given strain rate.
