
Figure 9:
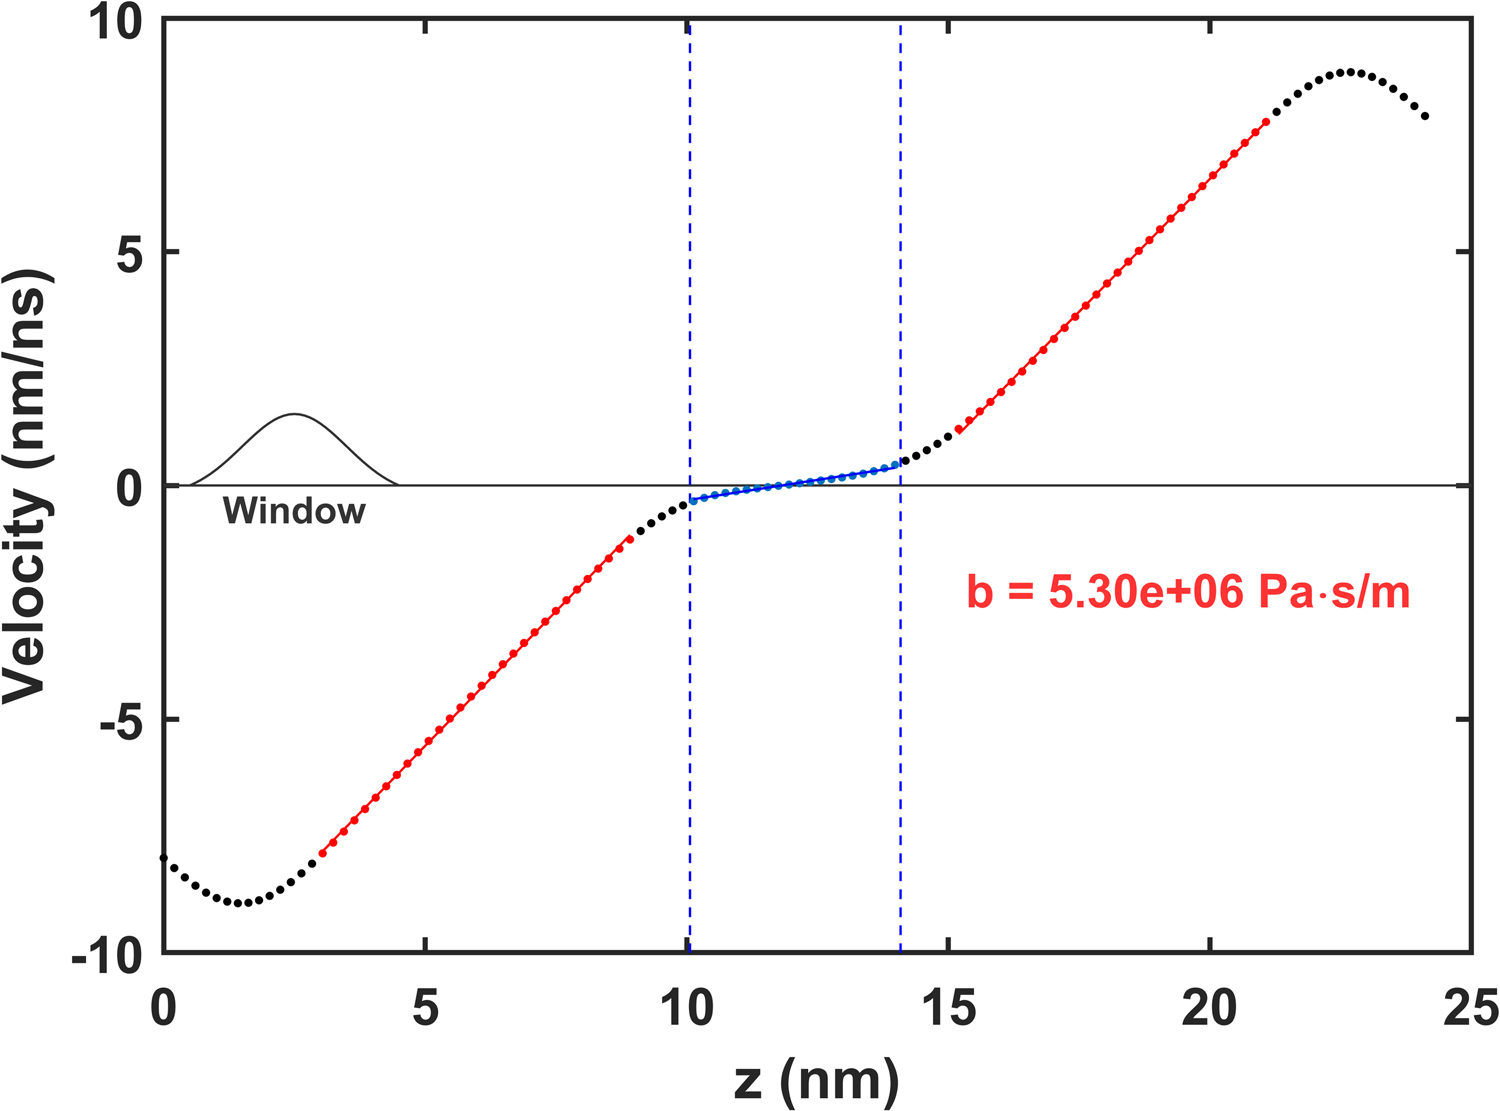
Average velocity profile for Martini DPPC with a 1.0 kJ/(mol-nm) force applied to all particles within 1 nm of the boundary at every timestep. The region corresponding to the membrane is highlighted in blue and the extent of linear parallel shear flow in the solvent is highlighted in red. Fits to these regions are used to determine the solvent shear rates. The spatial averaging window used to create the velocity profile is depicted on the left.