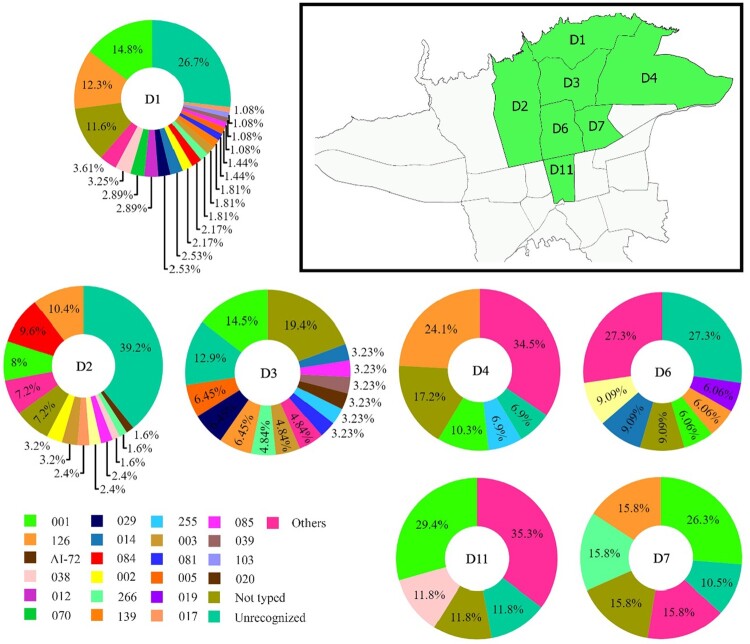
Figure 4.
Geographical distribution of C. difficile PCR ribotypes across different districts of Tehran. Pie charts represent the proportion of PCR ribotypes per 7 districts (D1–D4, D6, D7 and D11) of Tehran. The text on the map and in the centre of pie charts indicates the district number of typed isolates in Tehran. The percent of total numbers for the different ribotypes in the study districts are shown on each pie chart.

