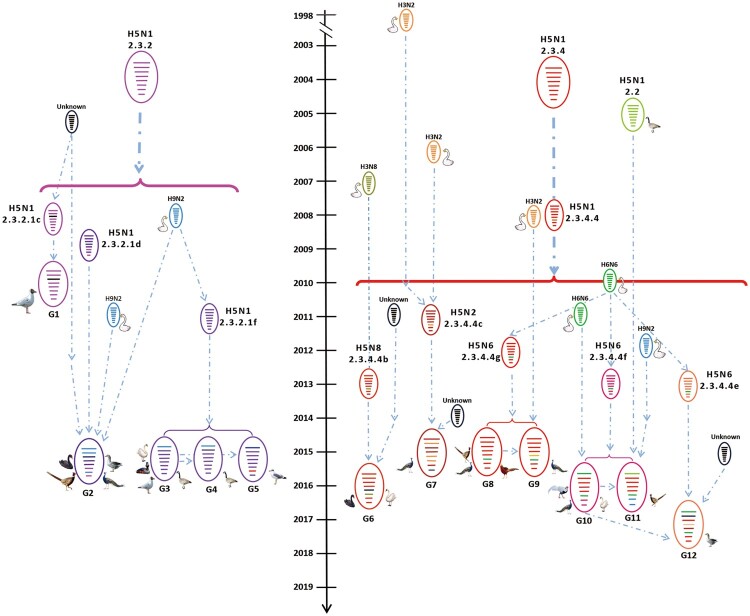
Figure 3.
Diagrammatic representation of the formation of different H5 reassortants. Viral particles are represented by coloured ovals containing horizontal bars representing the 8 gene segments (from top to bottom: PB2, PB1, PA, HA, NP, NA, M, and NS). Segments in descendant viruses are coloured according to their corresponding source virus (top) to illustrate gene ancestry through reassortment events. Possible donor viruses are adjacent to arrow tails; arrowheads point to the resulting reassortants. The timeline in the middle indicates the possible time of virus emergence or reassortment events. The tMRCA was estimated by using the Bayesian Markov chain Monte Carlo method in the BEAST v1.8.4 software package.

