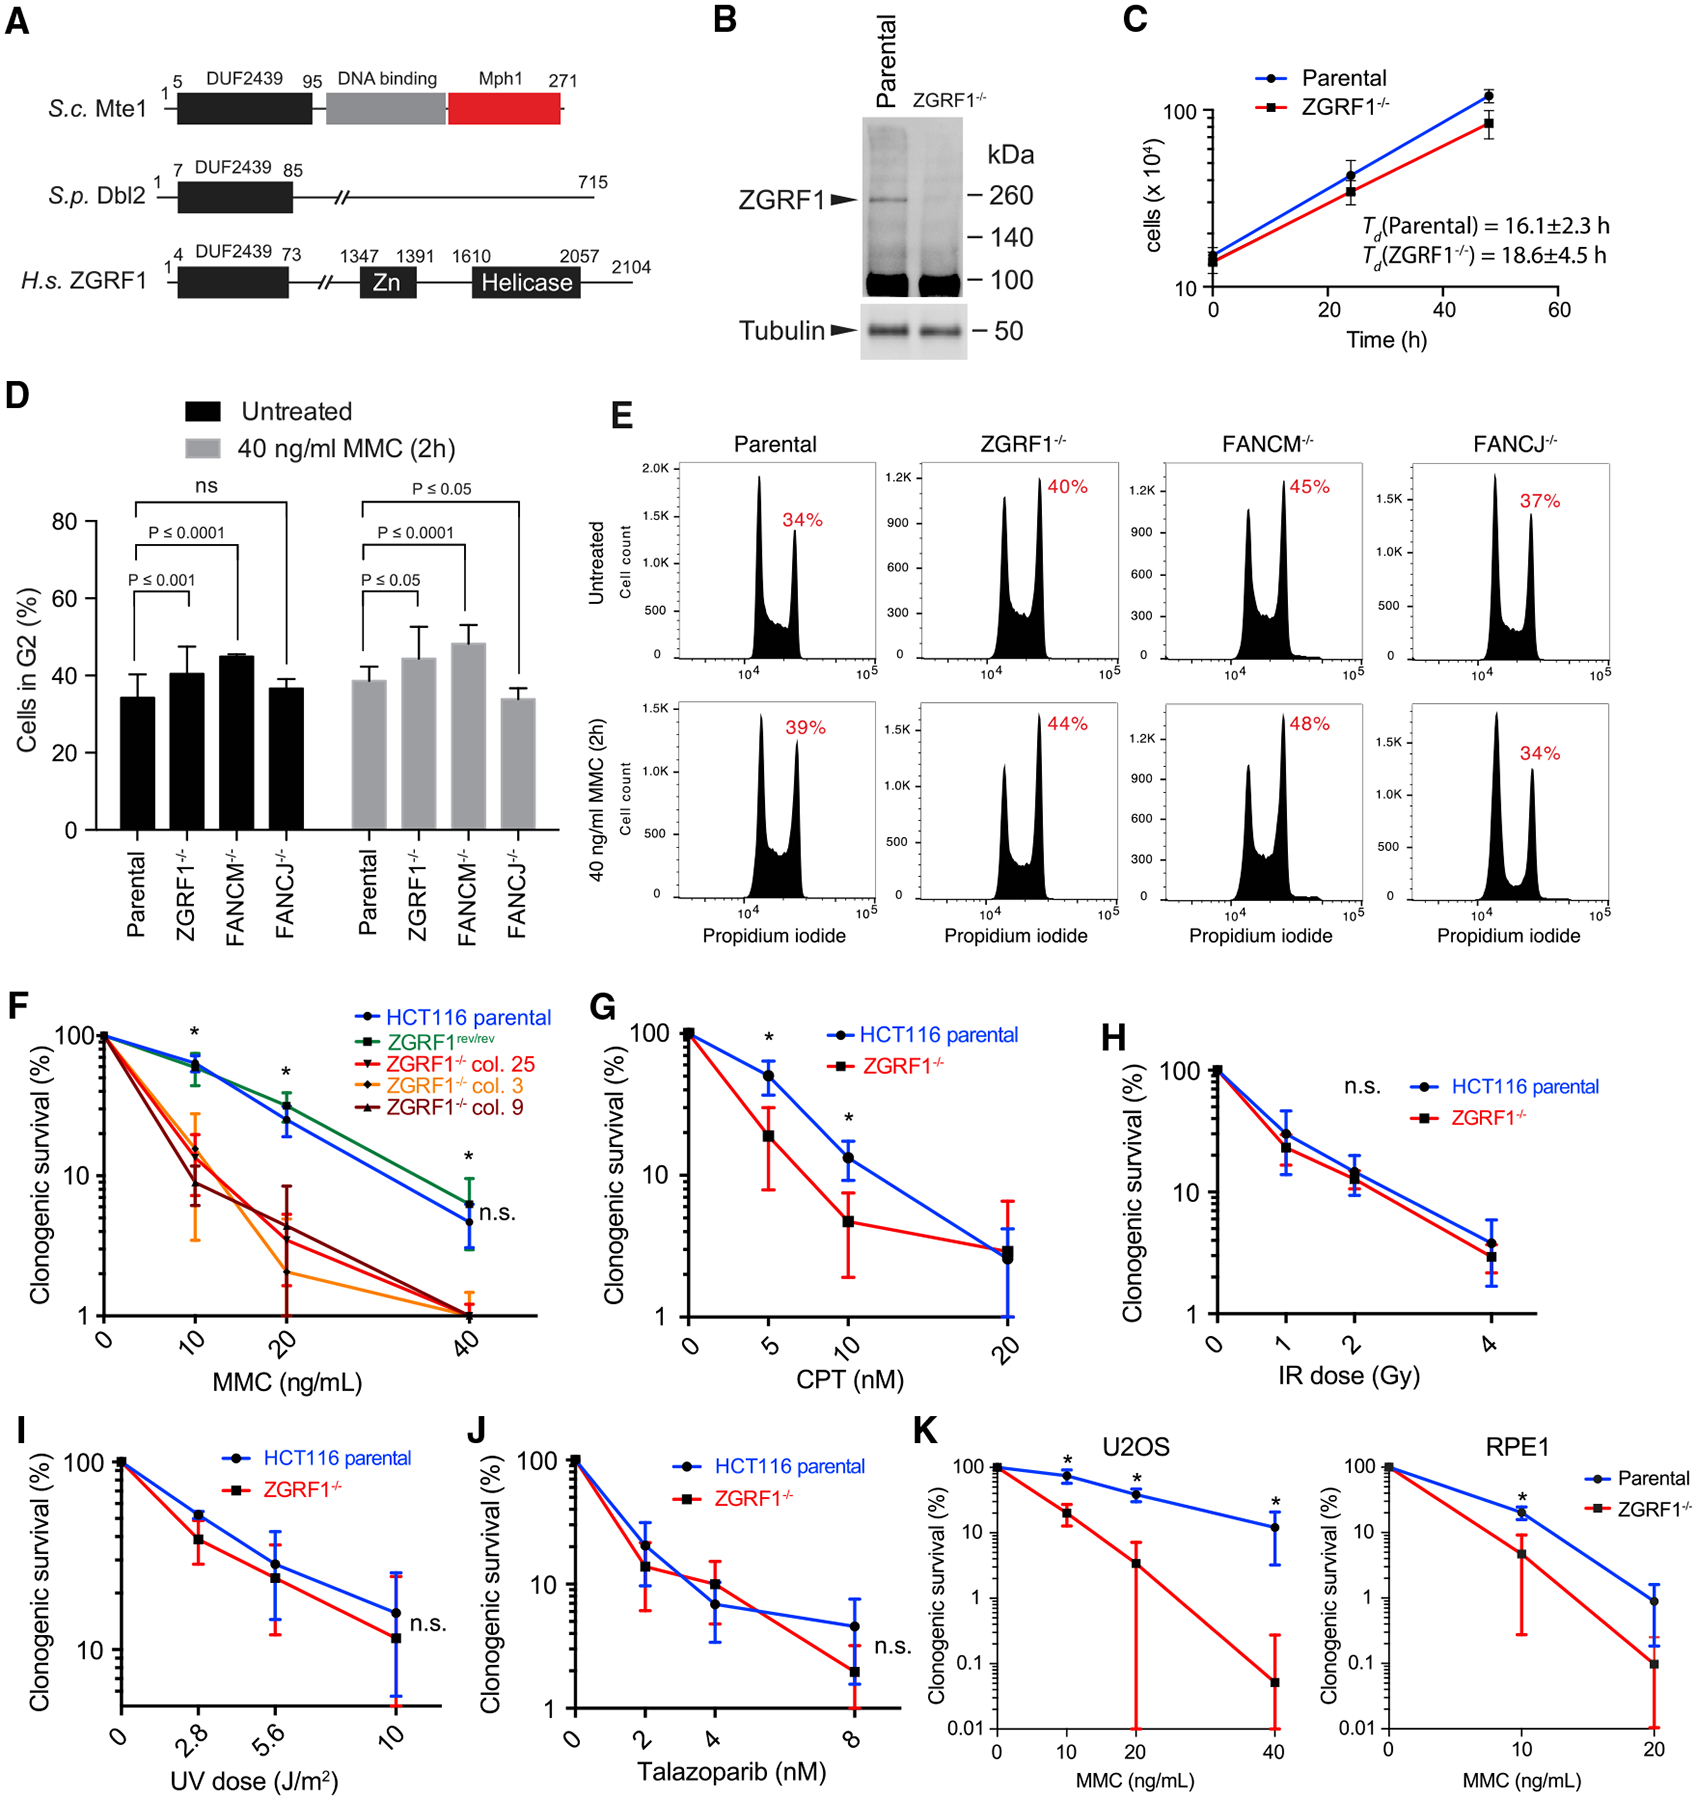
Figure 1. ZGRF1 Is Important for DNA Interstrand Crosslink Repair.

(A) Domain organization of ZGRF1. The DUF2439 domain is conserved between S. cerevisiae Mte1, S. pombe Dbl2, and human ZGRF1. The DNA binding and Mph1 interaction domains are indicated for Mte1. The putative DNA binding Zn finger and helicase domains are indicated for ZGRF1.
(B) Western blot of ZGRF1 in HCT116 parental and ZGRF1−/− cell lines.
(C) ZGRF1−/− cells exhibit slow growth. HCT116 parental and ZGRF1−/− cells were cultured for 48 h, and cell density was determined at 24 h intervals. Error bars indicate SD (n = 5).
(D) ZGRF1−/− cells accumulate in G2. Quantification of G2 accumulation in HCT116 parental, ZGRF1−/−, FANCM −/−, and FANCJ−/− cells in unperturbed condition and in response to MMC treatment. Means from three independent experiments are plotted as bars. Error bars represent 95% confidence intervals. p values were calculated using two-way ANOVA on the basis of three independent biological replicates.
(E) Representative cell cycle profiles of propidium iodide stained cells, either untreated or treated with 40 ng/mL MMC for 2 h followed by recovery for 24 h.
(F) Colony formation assay of HCT116 parental, ZGRF1rev/rev, and three independent ZGRF1−/− cell lines treated with the indicated doses of MMC for 24 h. The graph of the parental cell line is statistically different from each of the knockout cell lines (p < 0.05, t test) but not significantly different from ZGRF1rev/rev (n.s.).
(G–J) Colony formation assays of cells treated with the indicated doses of CPT (G) for 24 h, ionizing radiation (X-rays) (H), ultraviolet radiation (UV-C) (I), or the poly (ADP-ribose) polymerase (PARP) inhibitor talazoparib (J).
(K) Colony formation assay of U2OS and RPE-1 parental and ZGRF1−/− cell lines treated with the indicated doses of MMC for 24 h.
n ≥ 3 for each cell line. All graphs show the mean with 95% confidence interval. Statistical significance was calculated using unpaired t tests without assuming consistent SD. *p < 0.05. n.s., no significant difference.
