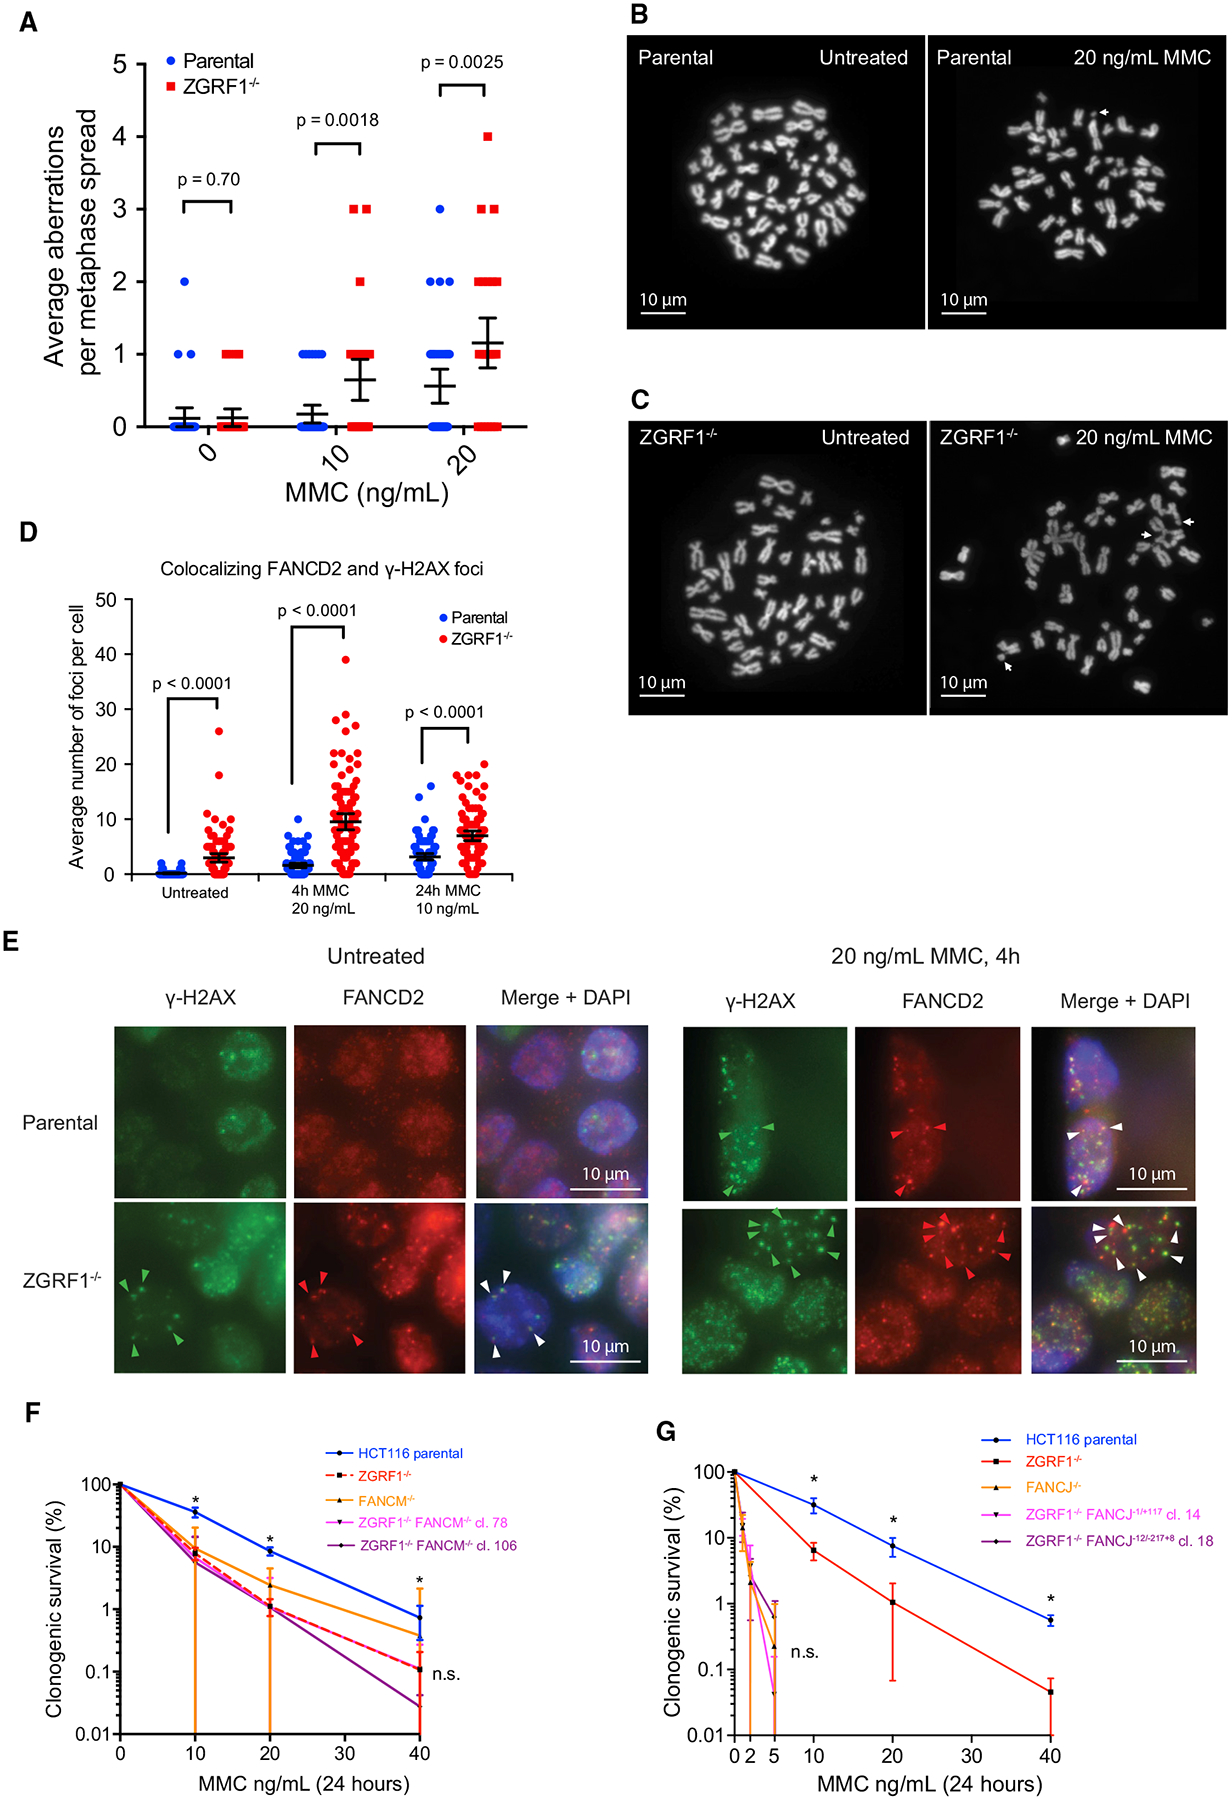
Figure 2. ZGRF1 Contributes to the FA Pathway.

(A) Quantification of chromosomal aberrations in HCT116 parental and ZGRF1−/− cells. Means with 95% confidence intervals are plotted. p values were calculated using Mann-Whitney U tests. N ≥ 32 spreads per condition.
(B and C) Examples of metaphase spreads from parental cells (B) or ZGRF1−/− cells (C) untreated or treated with 20 ng/mL MMC for 24 h. White arrows mark chromosomal aberrations. The images shown highlight the types of aberrations scored rather than being representative of the number of aberrations seen per spread.
(D) ZGRF1−/− cells show a higher frequency of co-localizing γ-H2AX and FANCD2 foci under both unperturbed conditions and when treated with MMC. Quantification of co-localizing γ-H2AX and FANCD2 foci under unperturbed conditions and with two different treatments with MMC is shown. Error bars show 95% confidence intervals. p values were calculated using Mann-Whitney U tests. N > 100 cells for each condition.
(E) Representative images of HCT116 parental and ZGRF−/− cells under unperturbed conditions or after treatment with 20 ng/mL MMC for 4 h. Arrows mark co-localizing foci for one cell, where the pixel intensity of FANCD2 foci was a minimum of 6,000 arbitrary units higher than background. Cells with very low or absent γ-H2AX foci were not scored, as this indicated inadequate immunostaining.
(F) Colony formation assay of HCT116 parental and ZGRF1−/− and FANCM−/− single- and double-mutant cell lines treated with the indicated doses of MMC for 24
h. The graph of the parental cell line is statistically different from each of the knockout cell lines (p < 0.05, t test), but the knockout cell lines are not significantly different from each other (n.s.).
(G) Colony formation assay of HCT116 parental and ZGRF1−/− and FANCJ single- and double-mutant cell lines treated with the indicated doses of MMC for 24 h. The graph of the parental cell line is statistically different from the ZGRF1-knockout cell line (p < 0.05, t test). The FANCJ single- and double-mutant cell lines are not significantly different from each other (n.s.).
Graphs in (F) and (G) show the mean with 95% confidence interval. Statistical significance was calculated using unpaired t tests without assuming consistent SD. *p < 0.05. n.s., no significant difference. n ≥ 3 for each cell line.
