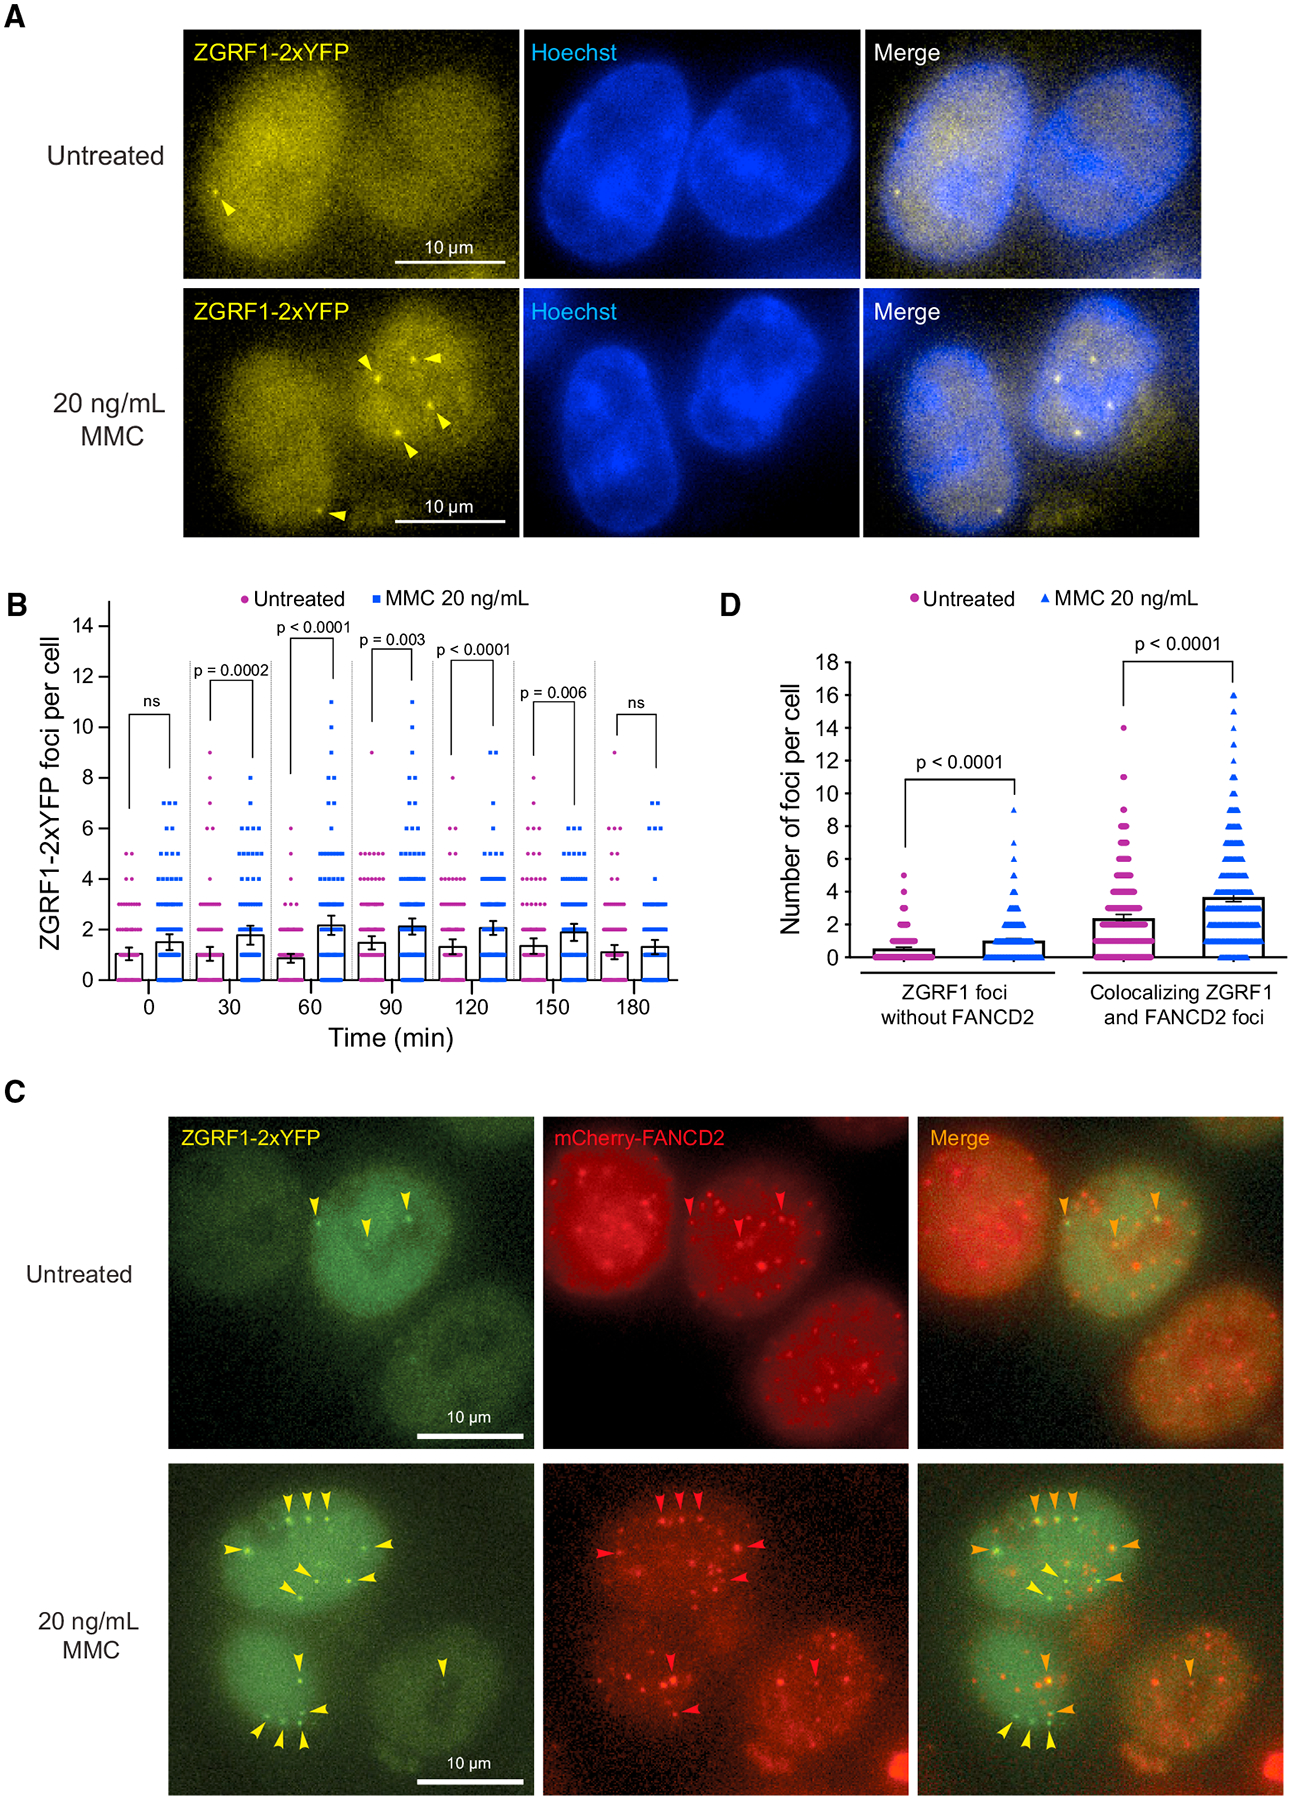
Figure 3. ZGRF1 Colocalizes with FANCD2 at DNA Damage-Induced Foci.

(A) ZGRF1 localizes to nuclear foci during ICL repair. Cells expressing ZGRF1–2xYFP from the endogenous promoter were synchronized at the G1/S border by treatment with 2 mM thymidine for 18 h before release into S phase in Leibovitz’s L-15 medium containing 0.4 μM Hoechst 33258. Four hours before release, 20 ng/mL of MMC or vehicle was added to the cultures. Arrows indicate ZGRF1 foci.
(B) Quantification of ZGRF1 foci after MMC treatment. Quantification of the experiment in (A). Error bars show 95% confidence intervals. p values were calculated using Mann-Whitney U tests. N = 90–160 cells for each condition.
(C) Colocalization of ZGRF1 and FANCD2. Cells expressing ZGRF1–2xYFP from the endogenous promoter and ectopically integrated mCherry-FANCD2 were synchronized in S phase with 2 mM thymidine 18 h prior to microscopy. Four hours before microscopy, 20 ng/mL MMC or vehicle was added to the culture. Yellow arrows mark ZGRF1 foci, red arrows mark FANCD2 foci, and orange arrows mark the co-localizing foci.
(D) Quantification of co-localizing FANCD2 and ZGRF1 foci in the experiment reported in (C).
Error bars show 95% confidence intervals. p values were calculated using Mann-Whitney U tests. N > 400 cells for each condition.
