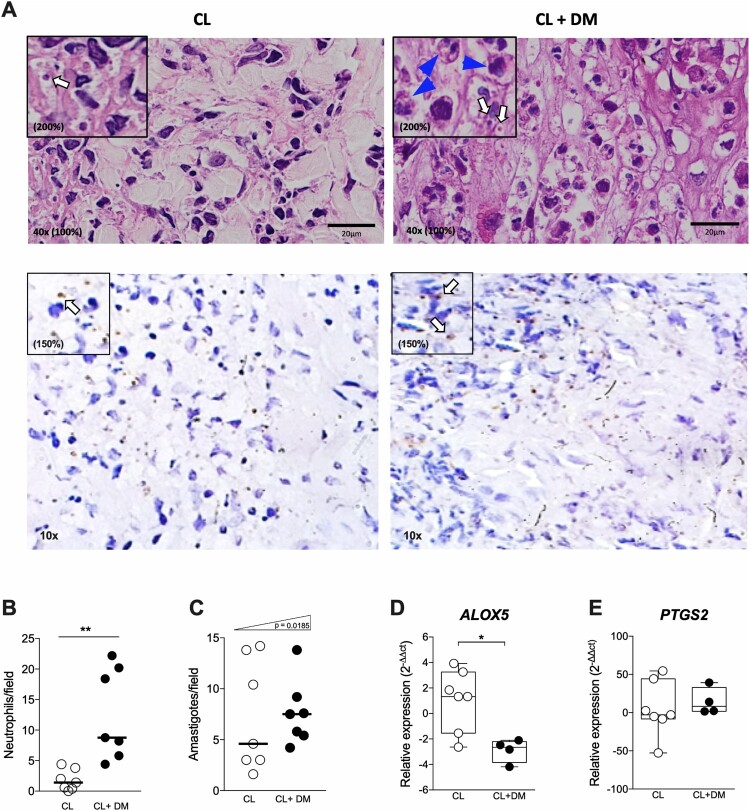
Figure 4.
DM individuals are more prone to CL infection. (A) Histological images of a representative CL (left) and CL + DM (right) lesions in HE (above) and IHQ (below). Quantification of neutrophils (B) and amastigotes for field (C) in the lesions of CL and CL + DM individuals. Expression of ALOX5 (D) and PTGS2 (E) in the lesion of CL and CL + DM individuals detected by RT-qPCR. Blue arrows: neutrophils; white arrows: amastigotes. Scale bar: 20 µm. 40x objective with 200% digital magnification in HE and 150% in IHQ. Data shown in median (B,C). Box and whiskers with min to max (D,E). Mann-Whitney test (B,D). Chi-squared test for trend (C). *p < 0.05; **p < 0.01.

