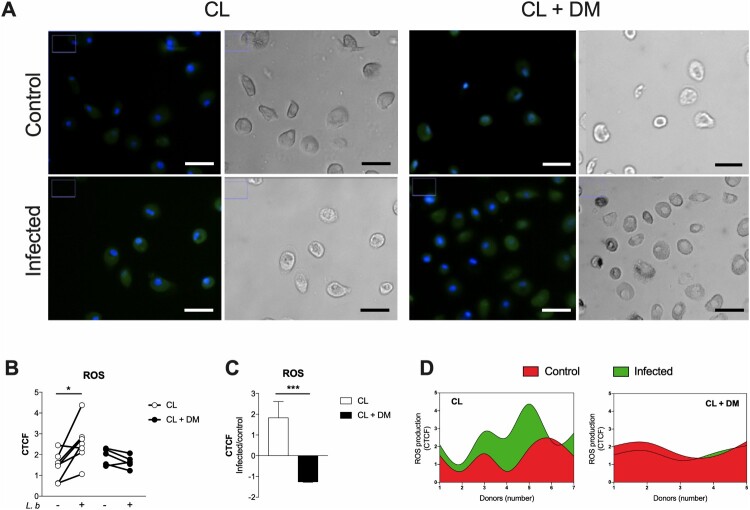
Figure 6.
Unaltered production of ROS after L. braziliensis infection of monocyte-derived macrophages from CL + DM individuals. Representative images of ROS production in monocyte-derived macrophages from CL and CL + DM individuals, before (control) and after infection by L. braziliensis (infected) (A). Quantification of ROS production in monocyte-derived macrophages from CL (open circles) and CL + DM (full circles) individuals after L. braziliensis infection (B). Ratio of ROS production between infected and control samples of CL and CL + DM individuals (C). Cubic spline analysis of donor-specific ROS production in monocyte-derived macrophages before (red) and after (green) L. braziliensis infection from CL and CL + DM individuals. CTCF: Corrected Total Cell Fluorescence. Green: ROS production; blue: cell nucleus. 40x magnification. Scale bar = 10 µm. Data represent individual values before and after infection (B). Data shown in median with interquartile range (C). Wilcoxon’s test (B). Mann-Whitney test (C). *p < 0.05; ***p < 0.001.

