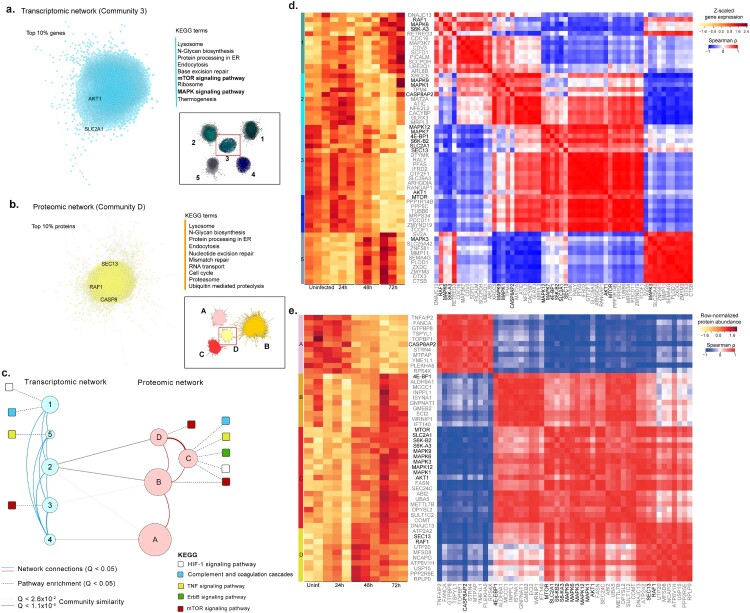
Figure 2.
Network analysis using genes and proteins. Analysis of the most central communities in each network highlights key KEGG terms (right) among the top 10% associated genes and proteins. The top 10% correlations (Spearman rho > 0.95, FDR < 0.05) were selected in the most central community in transcriptomic (a) and proteomic (b) networks (inset) based on mean normalized degree. The top KEGG terms associated with each of the two communities (FDR < 0.05) are highlighted, as well as genes that had been previously found in Figure 1(g). (c) A proteo-transcriptomic network analysis highlights coordinated expression and functional changes in response to viral infection. Communities (circles) in transcriptomic and proteomic networks, where node size is proportion to the number of elements (728 - 2519). Edges indicate association (Q<0.05) with KEGG terms (dashed), network edges (solid red and blue), or community similarity (solid gray). (d) Gene expression and co-expression among key genes and top correlated and central genes in each community identified based on a transcriptomic network (communities 1-5). (e) Protein abundance (A) and correlations (B – C) among key proteins and top correlated and central proteins in each community identified based on a proteomic network (communities A-D). For each community we identified selected the top ten genes (grey labels), ranked by their median centrality (median ranked degree, betweenness, closeness and eccentricity centralities), among the top 10% correlated gene in each community. Key proteins, previously associated with HIF-1α, mTOR, MAPK signaling and other top pathways, are highlighted in black (Figure 1(g)). Spearman rank correlations were computed for all genes and excluded if not statistically significant (Figure S2, FDR < 0.01).

