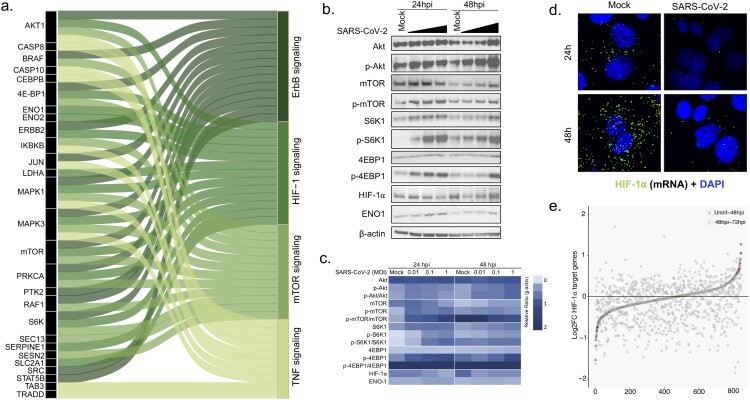
Figure 3.
SARS-CoV-2 modulates Akt-mTOR-HIF signaling. (a) Top four pathways, ErbB signaling, HIF-1 signaling, mTOR signaling and TNF signaling were selected and, together with proteins that are altered in the infection course, represented as Sankey Plot in order to illustrate the most important contribution to the flow of each pathway. (b) Huh7 cells were infected with SARS-CoV-2 at MOI of 0.01, 0.1 and 1 and cells were harvested at 24hpi and 48hpi. The representative western blots with indicated antibodies are shown. (c) A heatmap with the densitometric protein quantification is shown. All the MOI’s at each timepoint were normalized to β-actin. (d) HIF-1α m-RNA transcripts were visualized using RNAscope in mock infected and SARS-CoV-2 infected (MOI 1) Huh7 cells at 24hpi and 48hpi. (d) Graph showing upregulation and downregulation of HIF-1α target genes at 48hpi to 72hpi in the transcriptomics data as a measure of fold change. Significantly upregulated and downregulated genes are marked in red and green respectively.

