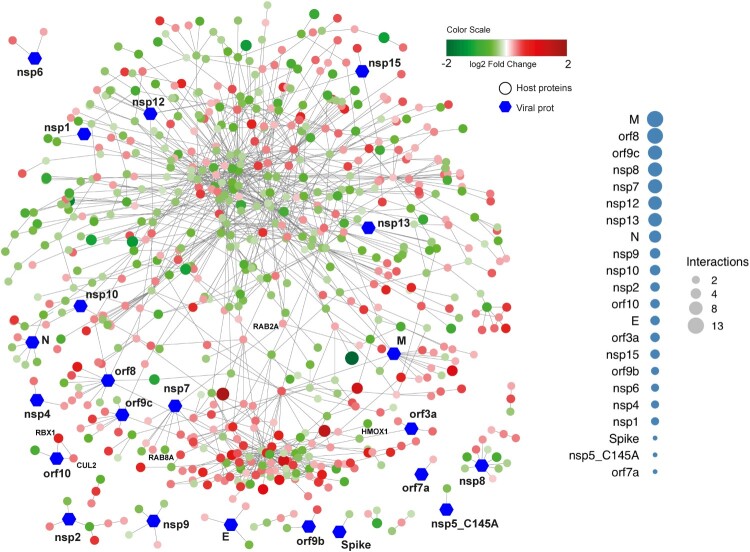
Figure 4.
Network visualizing protein interactions among significantly changing proteins between samples at 24hpi and 48hpi, and SARS-CoV-2 viral proteins. Green color nodes represent decreased proteins at 48hpi and red colored proteins represent increased proteins at 48hpi. Size of the nodes are relative to their log2 fold change. Hexagonal shaped nodes denote SARS-CoV-2 viral proteins. The edges are derived from Human Reference Interactom (HuRI) and SARS-CoV-2 entry in Human Protein Atlas.

