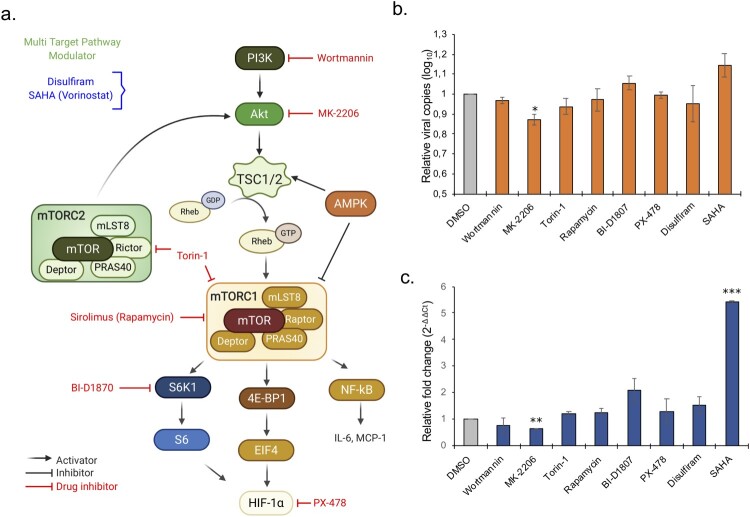
Figure 5.
Repurposing of approved drugs targeting Akt/mTOR/HIF-1 signaling pathway. (a) Schematic representation of Akt-mTOR-HIF-1 signaling. Only key proteins of the pathway and the inhibitors (red) and modulators (blue) used in the study are shown. (b-c) Antiviral assay for the inhibitors and modulators was performed in duplicates. (b) The bar graph shows relative viral copies compared to mock infection in the supernatant after 24 hpi. (c) The bar graph shows relative fold change of viral RNA based on the Ct-values in the cellular RNA after 24 hpi.

