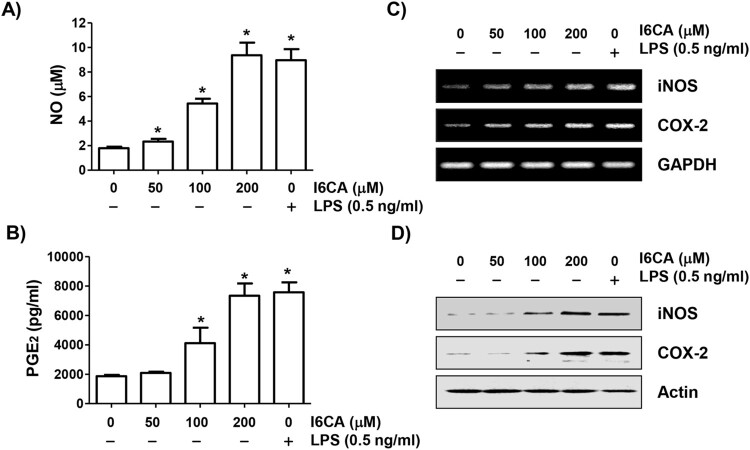
Figure 3.
Induction of NO and PGE2 production in I6CA-treated RAW 264.7 cells. The cells were treated with I6CA or LPS for 24 h. The levels of NO (A) and PGE2 (B) in culture media were measured. Data are presented as the means ± SD obtained from three independent experiments (#p < 0.05 compared to the control group). The expressions of iNOS and COX-2 mRNA (C) and protein (D) were detected by RT-PCR and immunoblotting. Glyceraldehyde 3-phosphate dehydrogenase (GAPDH) and actin were used as the internal controls for the RT-PCR and immunoblotting, respectively.

