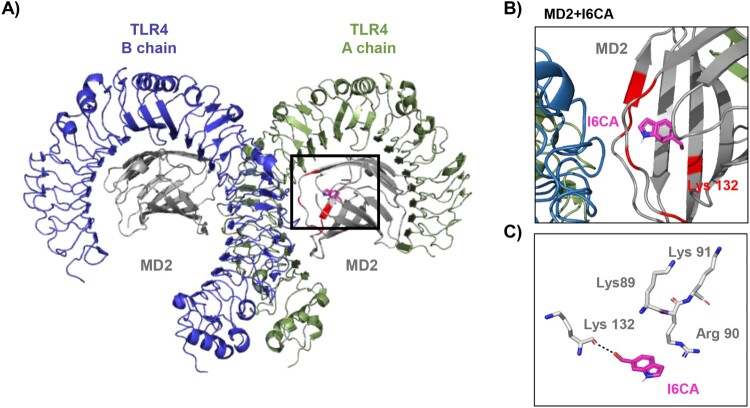
Figure 6.
The three-dimensional structure of I6CA and TLR4/MD2 complex. (A and B) Representative configurations of interaction with I6CA and TLR4/MD2 complex. TLR4 chain A, TLR4 chain B, MD2 and I6CA are indicated green, blue, gray and pink stick, respectively. The red colored regions represent the LPS binding residue. (C) The binding distance between I6CA and Lys132 residue of TLR4/MD2 complex.

