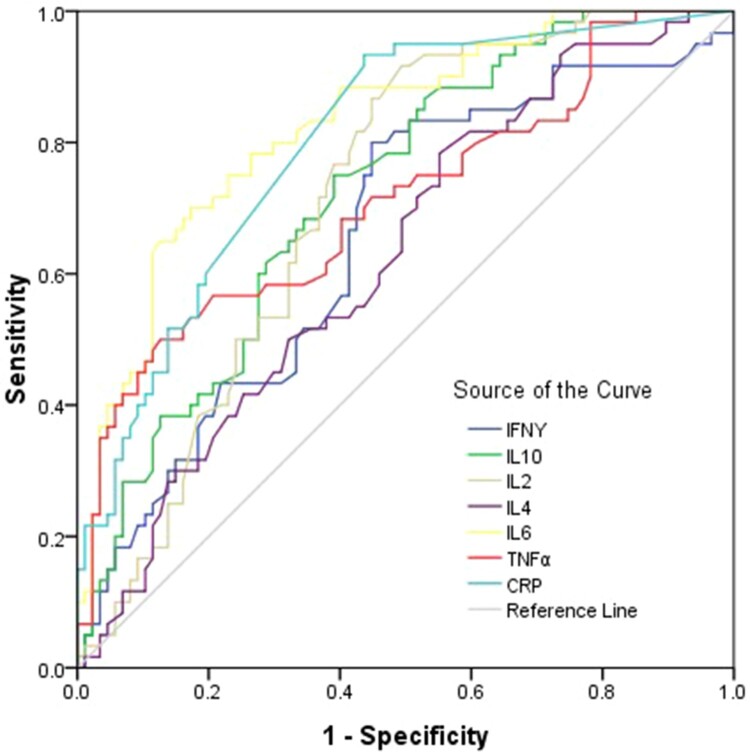
Figure 6.
ROC curve for diagnosis of severe and critical patients with COVID-19. Univariate logistic regression analysis was used to identify the severe and critical patients from controls and moderate COVID-19 patients. Performance of ROC curves of TNF-α, IFN-γ, IL-2, IL-4, IL-6, IL-10 and CRP for predicting severe and critical COVID-19 patients.

