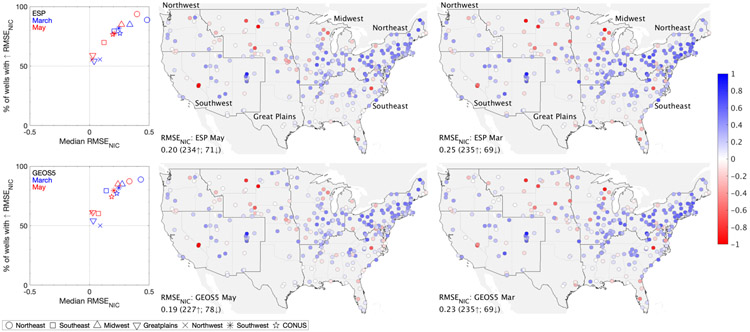
Figure 3:
GRACE-DA impact on the seasonal hindcast initialization using surface meteorological data from ESP and GEOS historical forecasts. On the right: spatial distribution of RMSENIC values derived from daily 3-month groundwater hindcasts initialized in May and March over the 2003-2016 period. In the bottom left of each map, the median value and number of wells with improved (↑) and degraded (↓) metrics. On the left: median (x axis) and percentage of wells with positive NIC values (y axis) computed for daily 3-month hindcasts initialized in May and March for each U.S. region (Northeast, Southeast, Midwest, Great Plains, Northwest and Southwest).

