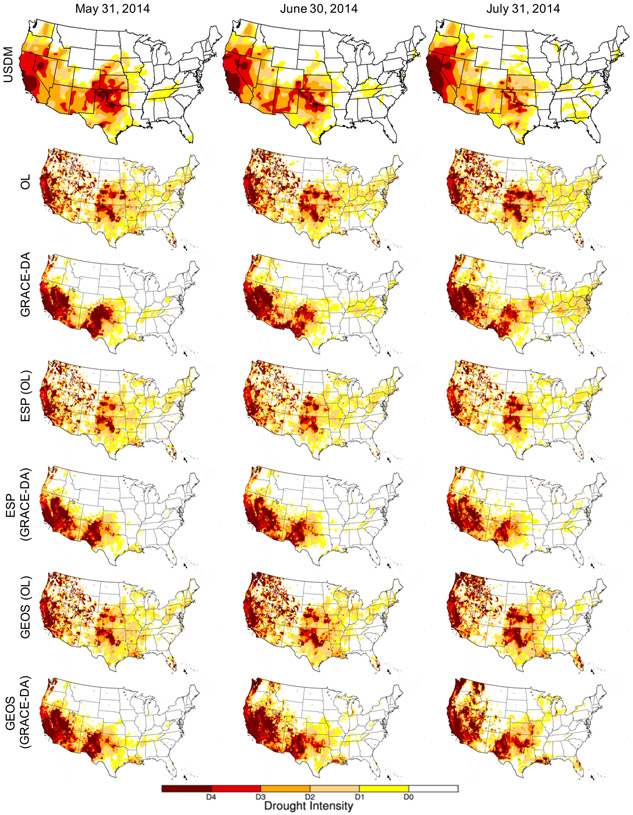
Figure 7:
U.S. drought intensity maps during major droughts in the Western and Southern U.S. between May and July 2014. From the top: U.S. Drought Monitor, retrospective OL and GRACE-DA runs, and ESP and GEOS hindcasts initialized with the May 1st GRACE-DA states. USDM estimates correspond to drought intensity in June 3rd, July 1st, and August 5th, and the other experiments are snapshots at the dates displayed on the top of each column.

