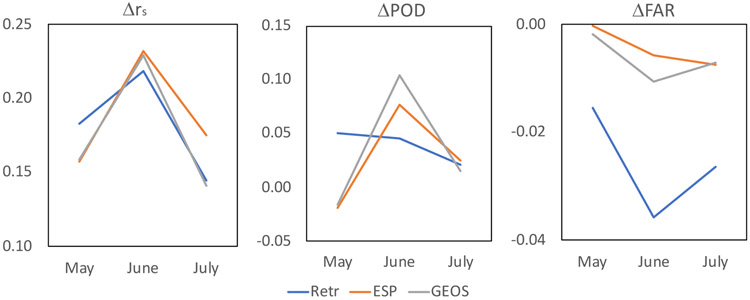
Figure 8:
Differential spatial correlation (Δrs), probability of detection (ΔPOD) and false alarm rate (ΔFAR) of drought severity index maps for three dates in 2014, as shown in Fig. 7. POD and FAR thresholds were defined as the extreme (D3) and exceptional (D4) drought events combined, corresponding to the 5th percentile. Values correspond to the improvement in skills when ESP and GEOS forecast techniques are initialized with GRACE-DA (i.e., GRACE-DA – OL). Differential values for the retrospective runs (Retr) are also shown for comparison purposes. Improvement is represented by positive values for rs and POD, and negative values for FAR.

