
Figure 2.
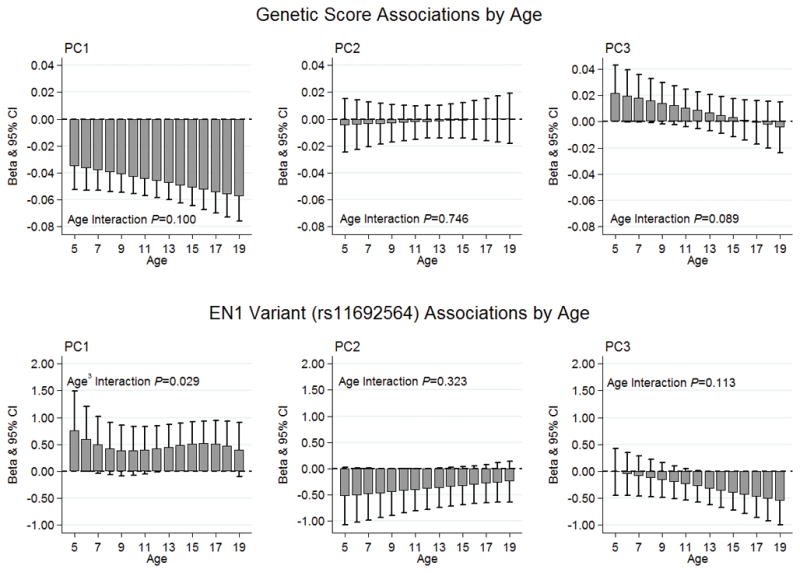
Candidate loci associations by age. Top row: no evidence of statistical genetic score-age interactions for PC1, PC2, or PC3. Bottom row: a quadratic, non-linear rs11692564-age interaction for PC1 (P=0.029); no statistical rs11692564-age interactions for PC2 or PC3. PC1, principal component 1 (concordant phenotypic model); PC2, principal component 2 (discordant phenotypic model for distal radius versus the hip and spine aBMD); PC3, principal component 3 (discordant phenotypic model for spine versus the hip and distal radius aBMD).