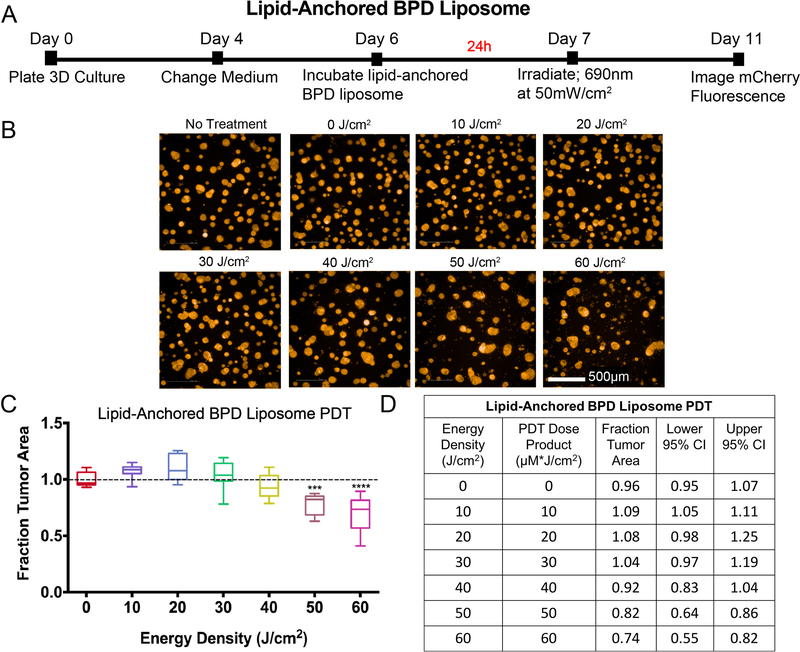
Figure 5. Lipid-anchored BPD liposome-PDT: experimental timeline and results.
A) Eleven-day timeline for experiments with lipid-anchored BPD liposome as the PS. On day 6, 1.0μM BPD equivalent of the formulation in growth medium was added to treatment wells and incubated for 24 hours. The PS-containing medium was removed and replaced with fresh medium, then treatment groups were irradiated on day 7. Imaging of mCherry fluorescence was performed on day 11. B) Image panel depicting mCherry fluorescence of 3D cultures treated with PDT with lipid-anchored BPD liposome. Scalebar: 500μm. C) Dose-response curve of results normalized to the no treatment control. Groups that are statistically different from no treatment were labeled according to p values. ( ***: p< 0.001, ****: p< 0.0001). All values are reported as median ± 95% CI and are summarized in D). Results table for lipid-anchored BPD liposome PDT. Median fraction tumor area with upper and lower 95% CI are reported. Because the PS concentration is 1μM, the PDT dose product (μM*J/cm2) is equal to the energy density (J/cm2). All groups received the lipid-anchored BPD liposome, including the 0 J/cm2 group, to evaluate the toxicity of the formulation on its own.

