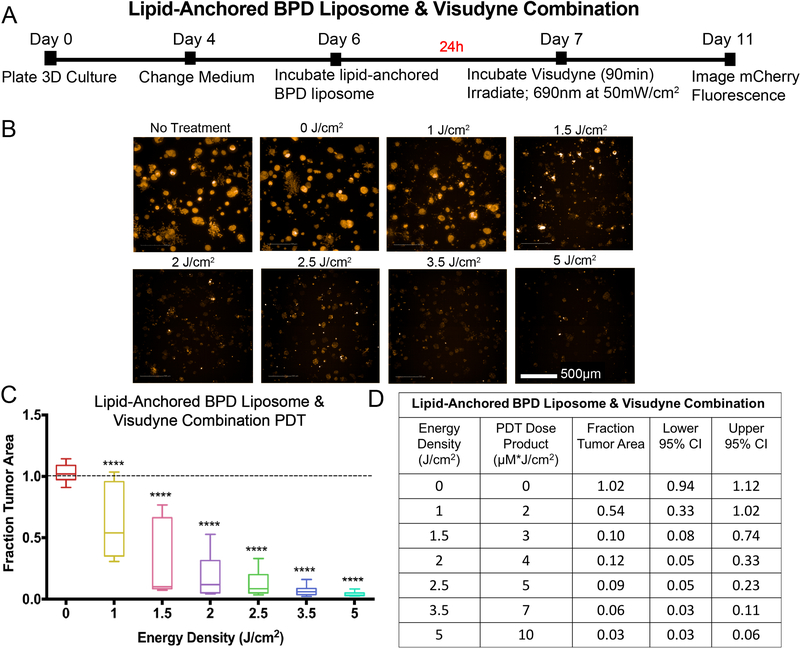
Figure 6: Combination Visudyne and lipid-anchored BPD liposome-PDT: experimental timeline and results.
A) Eleven-day timeline for PS combination experiments. 1.0μM of lipid-anchored BPS liposome was added to each treatment well on day 6 and incubated for 24 hours. PS-containing medium was removed on day 7, followed by the addition of 1μM Visudyne for 90 minutes. Irradiation was still performed on day 7 and plates were imaged on day 11. B) Panel of images of 3D cultures treated with lipid-anchored BPD liposome & Visudyne combination, at various energy densities. The images show mCherry fluorescence. C) Dose-response curve of PS combination experiments. Graph shows the energy density given (in J/cm2) vs. median fraction tumor area, which was normalized to the no treatment control group. Groups that were statistically different from no treatment were labeled according to p values. (****: p < 0.0001). D) Table quantifies PDT response. In the lipid-anchored BPD + Visudyne combination, the total PS concentration is 2μM, which is represented in the PDT dose product. All groups received both Visudyne and lipid-anchored BPD liposome, including the 0 J/cm2 group, to evaluate the toxicity of the combination alone.

