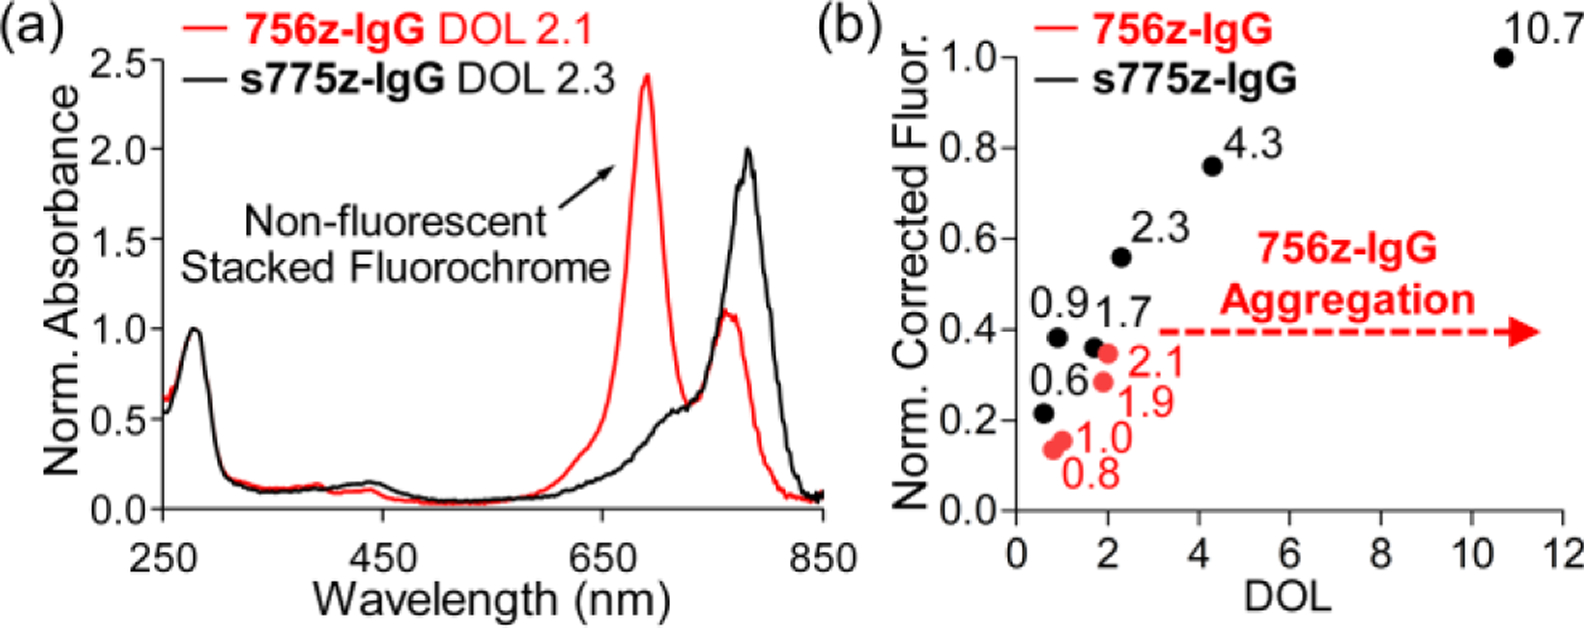
Figure 3.

(a) Absorbance spectra (normalized to the absorbance at 280 nm) for samples of 756z-IgG or s775z-IgG with very similar DOL. Only the 756z-IgG spectrum exhibits a blue-shifted peak corresponding to non-fluorescent stacked fluorochrome. (b) Plot of DOL for 756z-IgG or s775z-IgG versus fluorescence intensity (corrected for protein concentration and normalized relative to s775z-IgG DOL 10.7) for different bands of pure 756z-IgG or s775z-IgG on a polyacrylamide gel.
