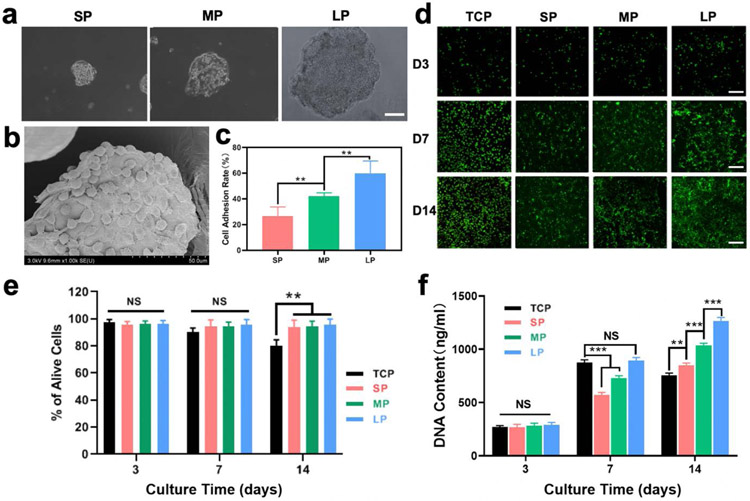
Figure 2.
In vitro biocompatibility of the BMSCs-laden microparticles: (a) the images of BMSCs-laden SP, MP, and LP particles after incubation for 24h. Scar bars represent 100μm; (b) Specific SEM image of BMSCs-laden particle; (c) Cell adhesion rate on different particles after incubation for 24h (n = 6); (d) CLSM images of BMSCs-laden microparticles when cultured for 3, 7, and 14 days. Live (green) cells are labeled with Calcein AM and dead (red) cells are labeled with ethidium homodimer. Scar bars represent 100μm; (e) Cell viability of different samples when cultured for 3, 7, and 14 days (n = 6); (f) Cell proliferation of different samples when cultured for 3, 7, and 14 days (n = 3). Data presented as mean ± SD, the error bars indicate the SD. P-values are calculated using one-way ANOVA with Sidak’s multiple comparison tests (c) and two-way ANOVA with Turkey’s multiple comparison tests (e,f), statistically significant ** P < 0.01, and *** P < 0.001. NS means no statistic difference.

