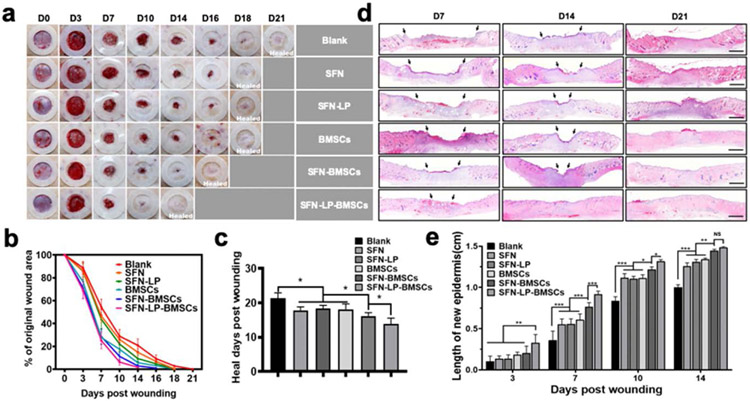
Figure 6.
Wound healing behaviors when treated with different groups: (a) Representative photo micrographs of wounds when treated with different groups for various days. The inner diameter of silicone splints is 1.5 cm; (b) Wound closure curves when treated with different groups; (c) Average healed time of the wounds treated with different groups; (d) Hematoxylin and Eosin (H&E) images of wounds when treated with different groups for 7, 14, and 21 days. Scale bars represent 2 mm; (e) The length of new epidermis of the wounds treated with different groups for 3, 7, 10, and 14 days. Data presented as mean ± SD, n = 6, the error bars indicate the SD, P-values are calculated using one-way ANOVA with Sidak’s multiple comparison tests (c) and two-way ANOVA with Turkey’s multiple comparison tests (e), statistically significant *P < 0.05, ** P < 0.01, and *** P < 0.001. NS means no statistic difference.

