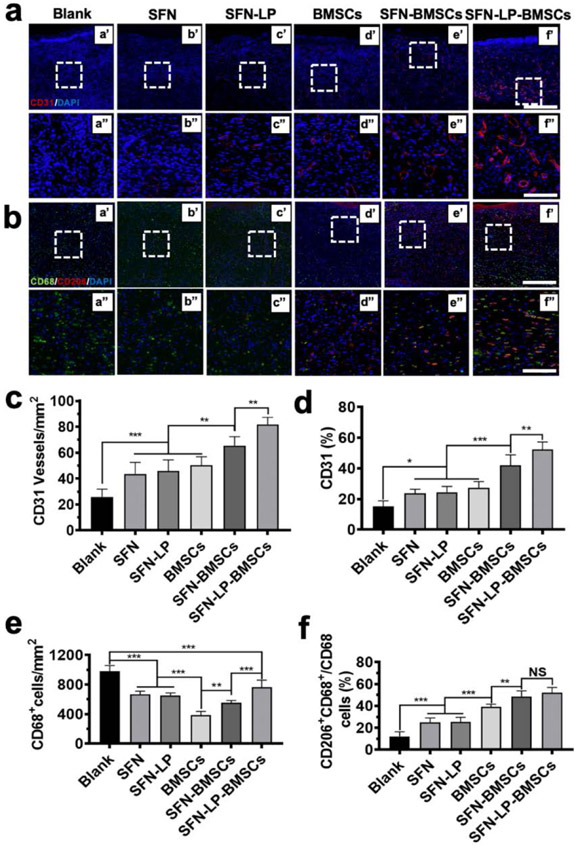
Figure 7.
Angiogenesis and immunoregulation at wound sites when treated with different groups for 14 days: (a) Representative fluorescent images of vascular endothelial cells at wounds treated with different groups. Endothelial cells were marked with CD31 (red) and DAPI (nuclei; blue) for difference treatment groups. Scale bars in a' -f' represent 400 μm, scale bars in a"-f" represent 100 μm; (b) Representative fluorescent images of macrophages at wounds treated with different groups. Macrophages were marked with pan-maker CD68 (green), M2 phenotype were marked with marker CD 206. The nuclei was marked with DAPI (blue). Scale bars in a' -f' represent 400 μm, scale bars in a"-f" represent 100 μm; (c) Blood vessel numbers per mm2 at wound sites treated with different group; (d) The percentage of CD31 vessel volume in fluorescent images; (e) CD68+ macrophages number per mm2 at wound sites treated with different group; (f) The percentage of M2 phenotype macrophages over total CD68+ macrophages at wound sites treated with difference treatment groups. Data presented as mean ± SD, n = 6, the error bars indicate the SD, P-values are calculated using one-way ANOVA with Sidak’s multiple comparison tests, statistically significant *P < 0.05, ** P < 0.01, and *** P < 0.001. NS means no statistic difference.

