
Figure 5.
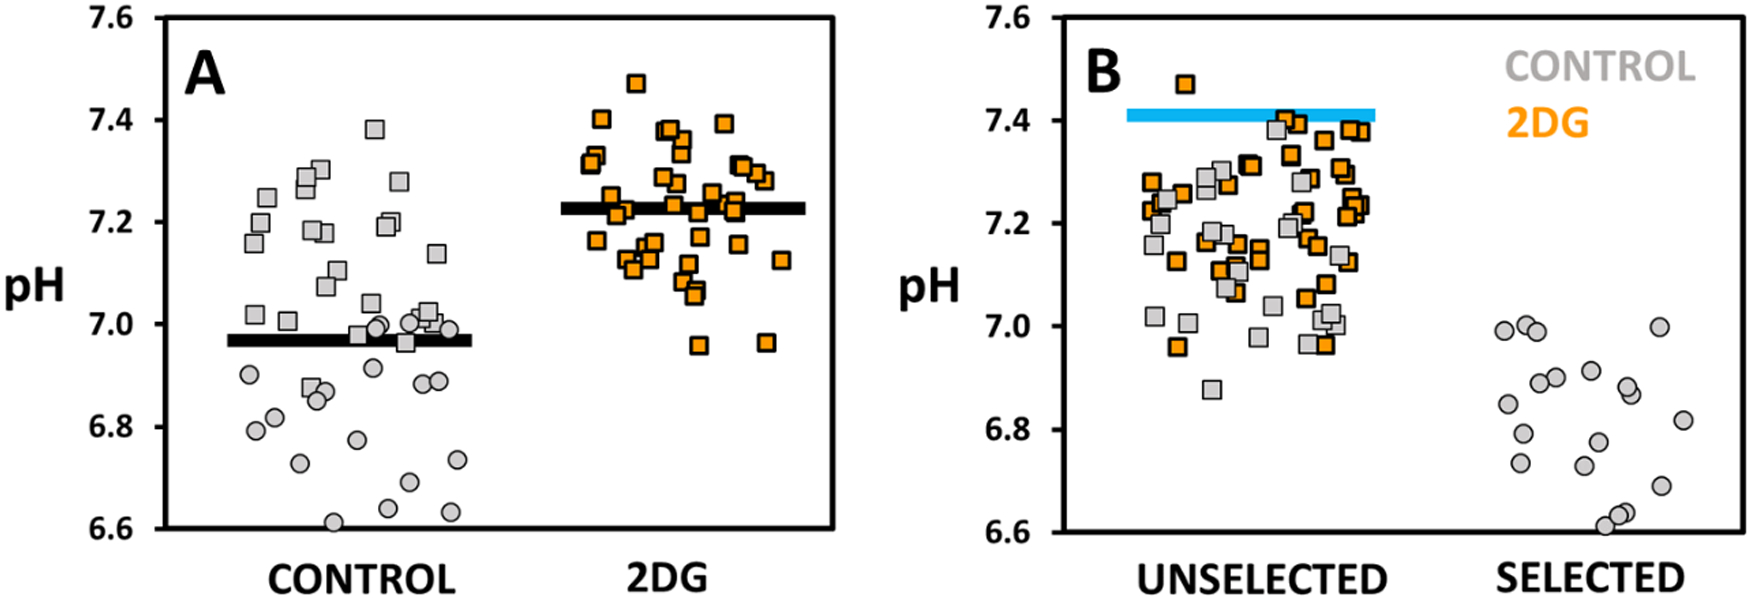
pH of droplets containing either control (grey) or 2DG treated (orange) K562 cells. Square markers annotate unselected, circular markers selected droplets. A) Droplets presented as control and 2DG treated cell populations. Average pH values, indicated by a black line, are 6.97 ± 0.03 (N = 46) for control and 7.23 ± 0.02 (N = 41) for 2DG treated cells. B) Droplets presented as unselected and selected populations. Blue line indicates the pH of empty droplets (pH 7.41 ± 0.04). The selection threshold was determined to be 6.96 ± 0.06 (fit shown in Figure S5b). While 2DG treated cells make up 47 % of cells prior to sorting, selected cells contain exclusively control cells (N = 22) excluding all the 2DG cells.