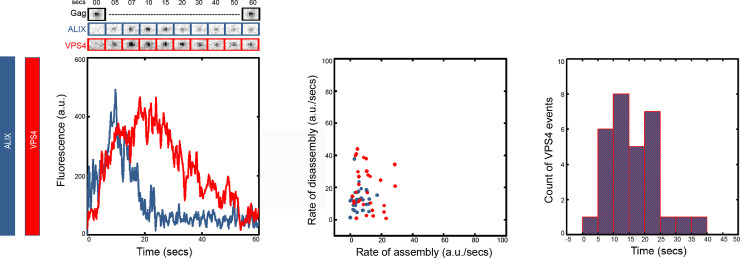
Fig 1. ALIX is disassembled in the presence of VPS4.
The left graph shows the intensity plot of ALIX (Blue) and VPS4 (Red) and cropped TIRF images of the Gag (topmost, Black), ALIX (middle, Blue) and VPS4 (bottom, Red). The scatter plot in the middle panel shows the rate of assembly and disassembly for ALIX and VPS4. The histogram on the right panel shows the distribution of the retention time of VPS4. (Rates of assembly/disassembly as well as the retention time are defined in S2 Fig).

