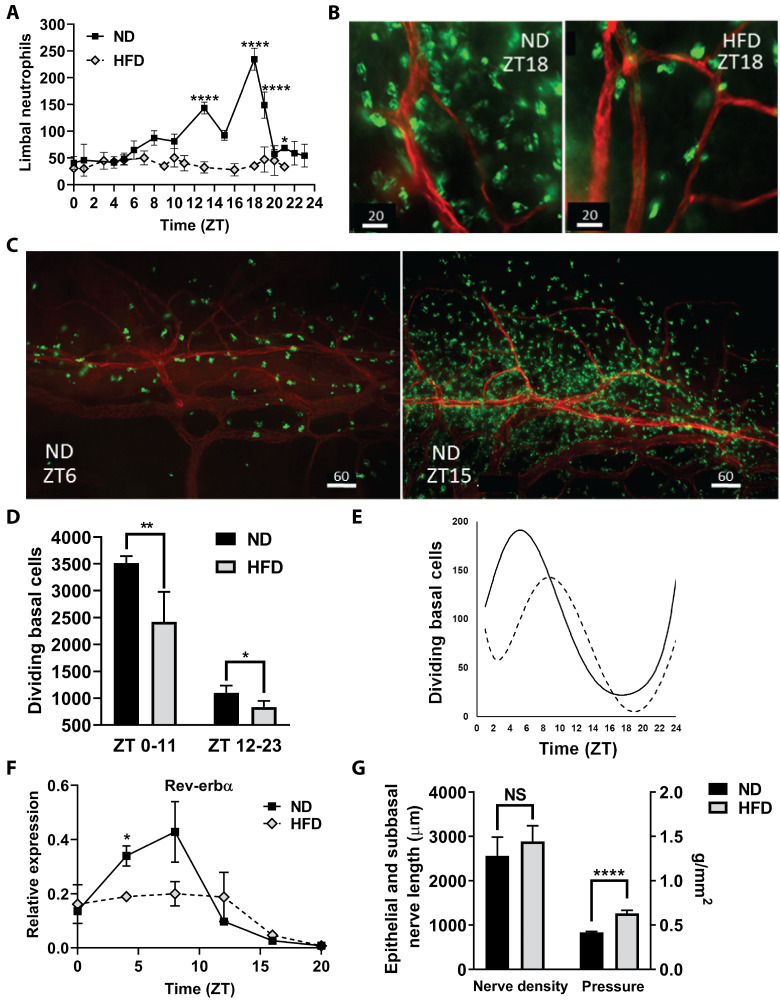
Fig 4. Corneal changes after 10 days on the high fat diet.
(A) Neutrophils were counted in four 40X microscope fields of view in extravascular limbal tissue at intervals over a 24h cycle (n = 4 corneas per group at each time point). (B) Representative micrographs of neutrophils in the limbus at ZT18, comparing limbal regions of mice fed a ND and a HFD; neutrophils (green), limbal blood vessels (red), scale bar = 20 μm. (C) Representative micrographs of neutrophils around the limbal vascular network at ZT6 and ZT15 in corneas from mice on ND; neutrophils (green), limbal blood vessels (red), scale bar = 60 μm. (D) The average of the sum of mitotic cells observed in the basal epithelium in nine perpendicular (horizontal and vertical) 40X microscopic fields across the cornea from limbus to limbus between ZT0-ZT11 and ZT12-ZT23 (n = 4 corneas per group collected every hour for 24h). (E) Changes in the number of mitotic cells in corneal epithelial cells over a 24h cycle. A polynomial function was used to fit the curve for the dividing cell number (the average of the sum of mitotic cells counted in nine vertical and horizontal 40X fields at each time point) with n = 4 corneas collected every hour for 24h (ZT scale). Solid line = ND, dotted line = HFD. (F) Expression of clock gene Rev-erbα over a 24h cycle (n = 2 independent pooled samples from 6–8 mice at each time point). (G) Nerve density (total axon length (μm) of the epithelial branches and subbasal plexus) in the corneal epithelium of ND mice and HFD mice (n = 4 per group). Corneal sensitivity, measured as the tactile pressure (g/mm2) required to elicit a blink, in mice fed the HFD for 10 days compared to ND fed mice (n = 6 per group). Data shown as means ± SD (A-E) and SEM (F, G). *p<0.05, **p<0.01, ****p<0.0001.

