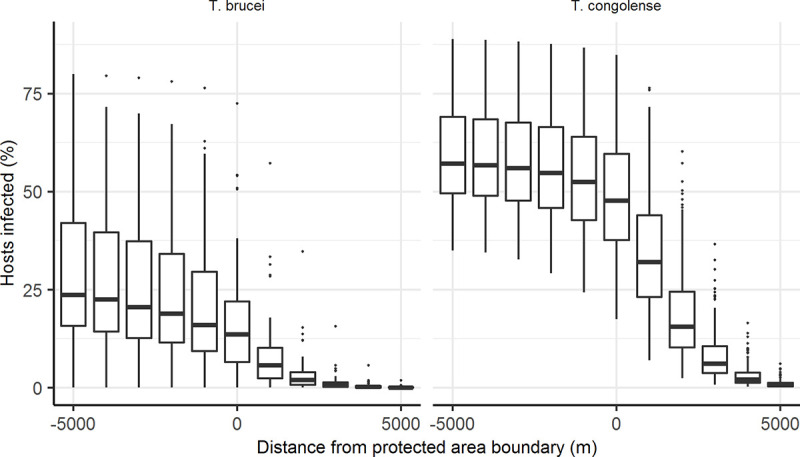
Fig 3. Modelled decline in trypanosome prevalence across the wildlife-livestock interface.

Assuming an additional probability of tsetse mortality/day in farming areas of 0.15 as per model fits to the observed tsetse data. The solid horizontal line in each boxplot shows the mean output from model runs using combinations of parameter values from sensitivity analysis that could explain the observed tsetse prevalence and hinges represent 25th and 75th percentiles.
