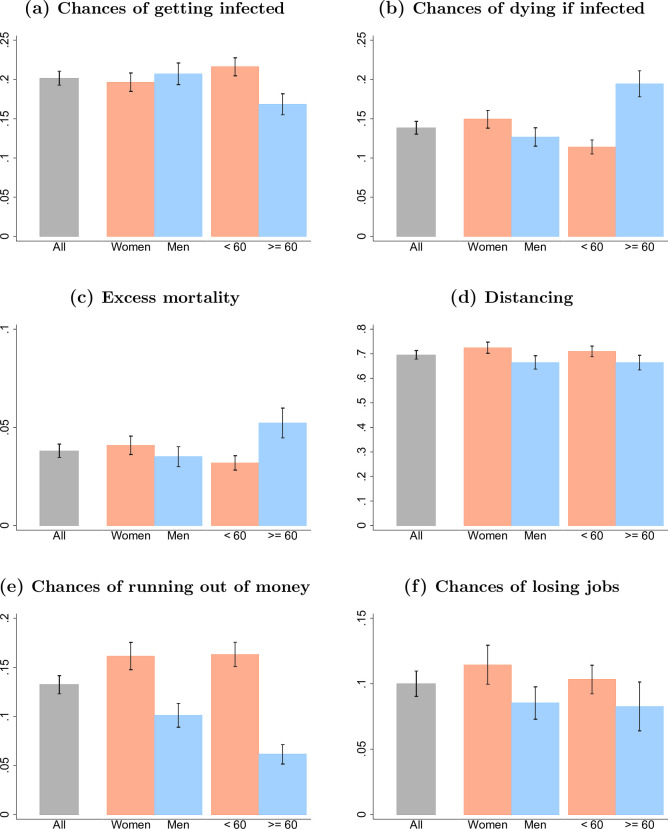
Fig 2. Difference in perceptions and social distancing practice by age and gender.
Data come from “Understanding America Study” (UAS) collected between March 10 and March 16, 2020. Bar plots show weighted means for the six variables we consider in our analysis along with their confidence intervals, derived based on weighted standard errors. We present these statistics for all U.S. residents, and by gender and age categories (below or above 60).

