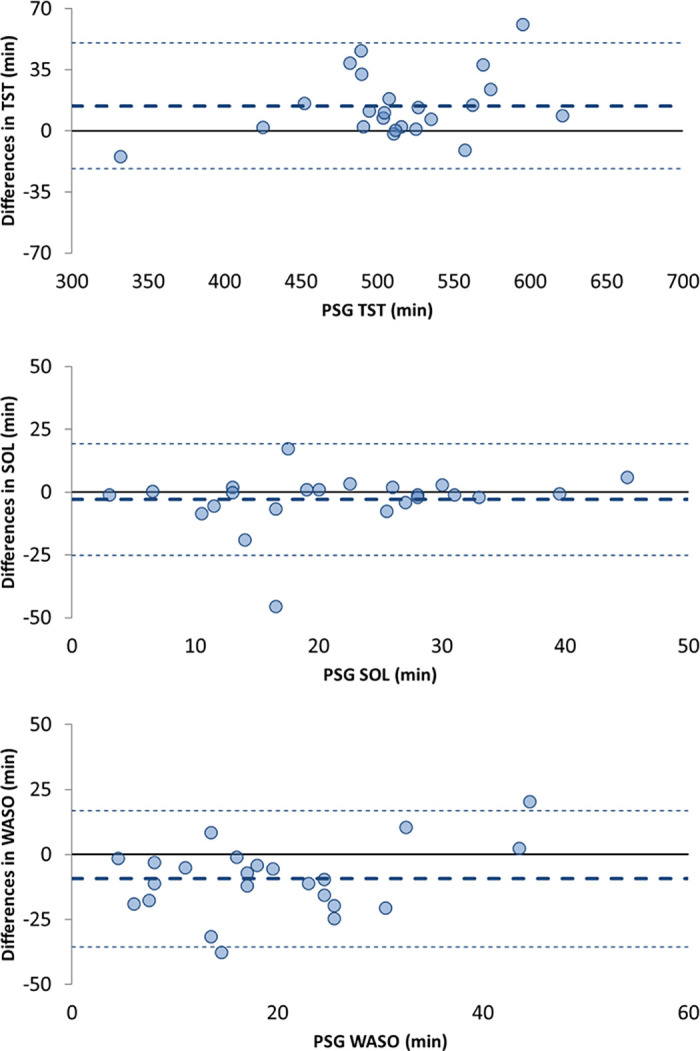
Fig 2. Bland-Altman plots for Total Sleep Time (TST), Sleep Onset Latency (SOL), and Wake After Sleep Onset (WASO).

The central dotted lines represent the Bland-Altman biases; the thin dotted lines represent the Bland-Altman agreement limits. *PSG is considered the gold standard for sleep assessment, therefore, mean bias was plotted against the PSG measurement alone and not the average of measures from PSG and the Fitbit Charge HR.
