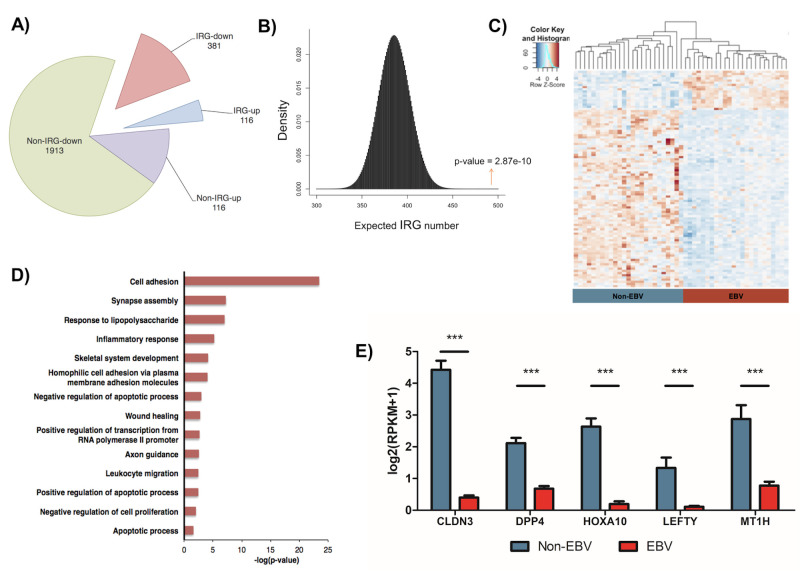
Fig 1. Transcriptomic profiling of immune response genes (IRGs) in EBV-associated gastric cancer (EBVaGC).
(A) Pie chart showed dysregulation of IRGs that made up around 20% of all the differentially-expressed (DE) genes in EBVaGC. (B) Hypergeometric simulation plot demonstrated the significant enrichment of IRGs in EBVaGC. The red arrow indicates the identified number of differentially regulated IRGs (497) with the corresponding p value (2.87e-10). (C) Heat map showed the hierarchical clustering of all DE IRGs, comparing between EBV-positive (right, red) and EBV-negative (left, blue) GC samples. (D) Functional enrichment analysis revealed the top biological processes associated with the suppressed IRGs. (E) Normalized mRNA expression of selected top down-regulated IRGs was compared between EBVaGC and non-EBV GC samples. Results were based on n = 23 and 25 samples, for EBVaGC and non-EBV respectively, and presented as mean ± SEM., (* p<0.05; ** p<0.01; *** p<0.001, Wilcoxon signed-rank test).

