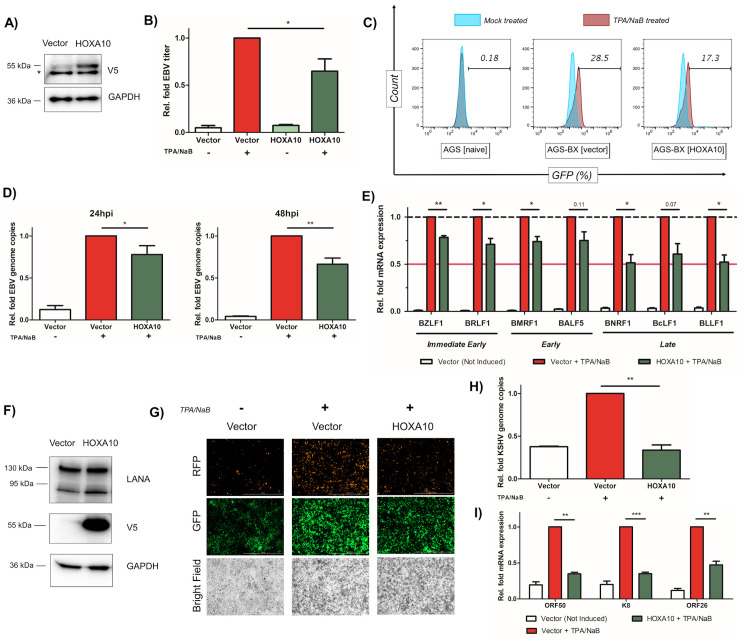
Fig 6. HOXA10 suppresses lytic replication of EBV and KSHV.
(A) Protein expression of V5-tagged HOXA10 in stably transduced AGS-BX cells was verified by immunoblotting. * indicates a non-specific protein band. (B) Newly produced EBV viruses from TPA/NaB treated or untreated AGS-BX cells stably expressing V5-HOXA10 or the vector control were titrated using Raji cells via flow cytometry. (C) Representative diagram of flow cytometry for (B). AGS cells were used to determine the background. (D) EBV genome copies (EBNA1 DNAs) in TPA/NaB treated AGS-BX cells stably expressing V5-HOXA10 or the vector control in the presence of Zinc (50uM) were measured by qPCR assays at 24 hpi (left panel) and 48 hpi (right panel). The relative level of EBNA1 DNAs in TPA/NaB treated AGS-BX cells transduced with the vector control was set up as 1. (E) Expression of EBV lytic genes (BZLF1, BRLF1, BMRF1, BALF5, BNRF1, BcLF1, BLLF1) in TPA/NaB treated or untreated AGS-BX cells stably expressing V5-HOXA10 or the vector control were measured by RT-qPCR assays at 24 hpi. (F) Protein expression of V5-tagged HOXA10 in transiently transfected HEK293.r219 cells was verified by immunoblotting. Protein expression of KSHV LANA was also probed. (G) Expression of GFP and RFP proteins in TPA/NaB treated or untreated HEK293.r219 cells transiently transfected with V5-HOXA10 or the vector control was visualized by fluorescence microscopy (scale bar = 1mm). (H) KSHV genome copies (ORF73/LANA DNAs) in TPA/NaB treated HEK293.r219 cells transiently expressing V5-HOXA10 or the vector control were measured by qPCR assays at 24 hpi. (I) Expression of KSHV lytic genes (ORF50/Rta, K8/K-bZIP, and ORF26) in TPA/NaB treated or untreated HEK293.r219 cells transiently expressing V5-HOXA10 or the vector control were measured by RT-qPCR assays at 24hpi. All of above results are based on n = 3 independent repeats and presented as mean ± SEM (* p<0.05; ** p<0.01; *** p<0.001, two-tailed paired Student t-test).

