
Figure 1. CDC-defined CRE admission rates at participating hospitals.
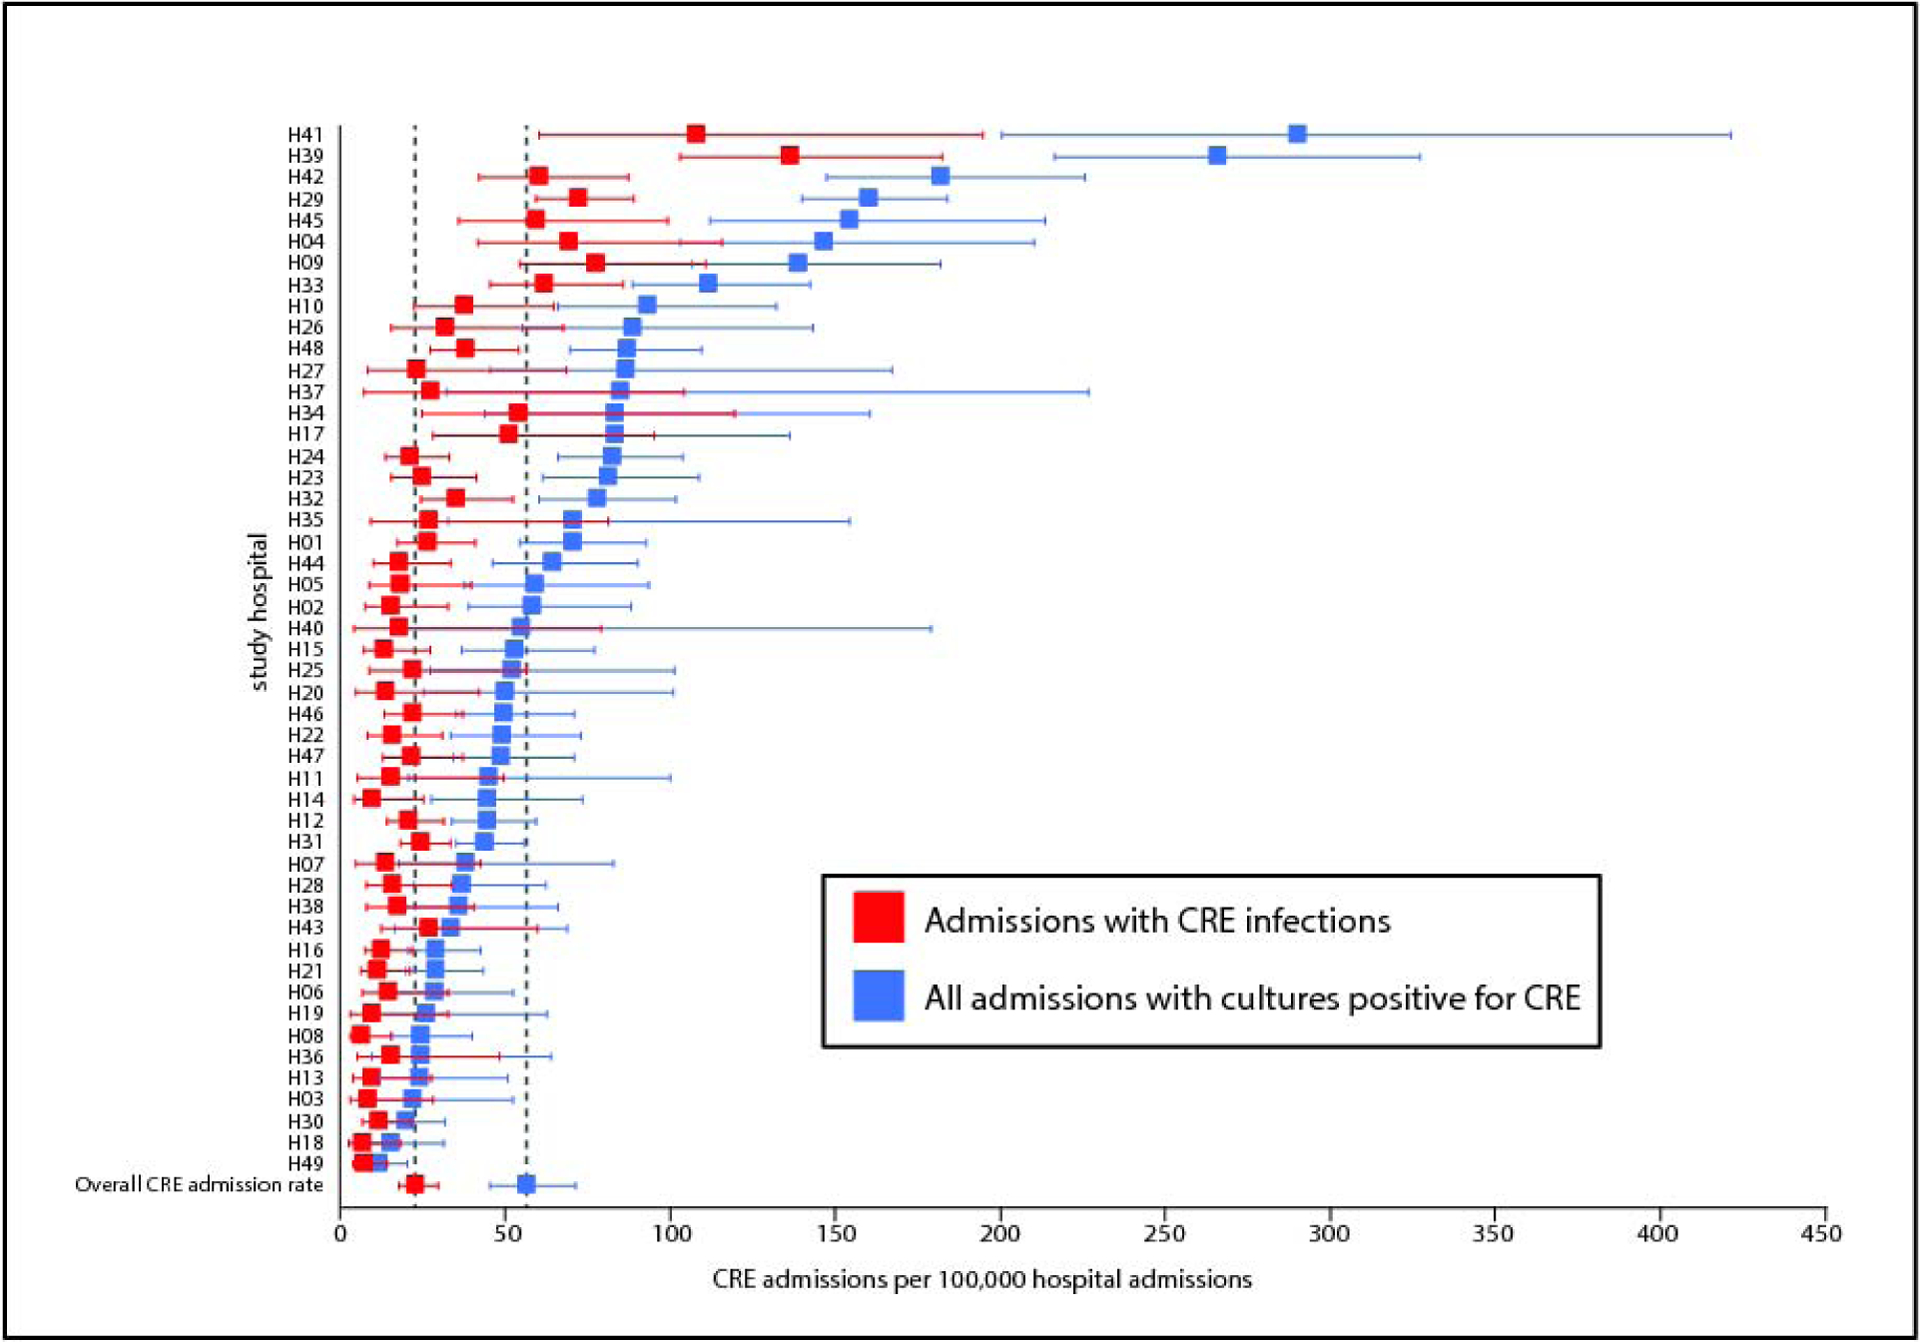
The rates of all admissions during which CRE were identified (blue), and of admissions during which at least one CRE infection was diagnosed (red) are shown. CDC-defined CRE admission rates and robust 95% CIs were estimated using a generalized linear mixed effects model with hospital as a random effect. Error bars indicate 95% confidence intervals.