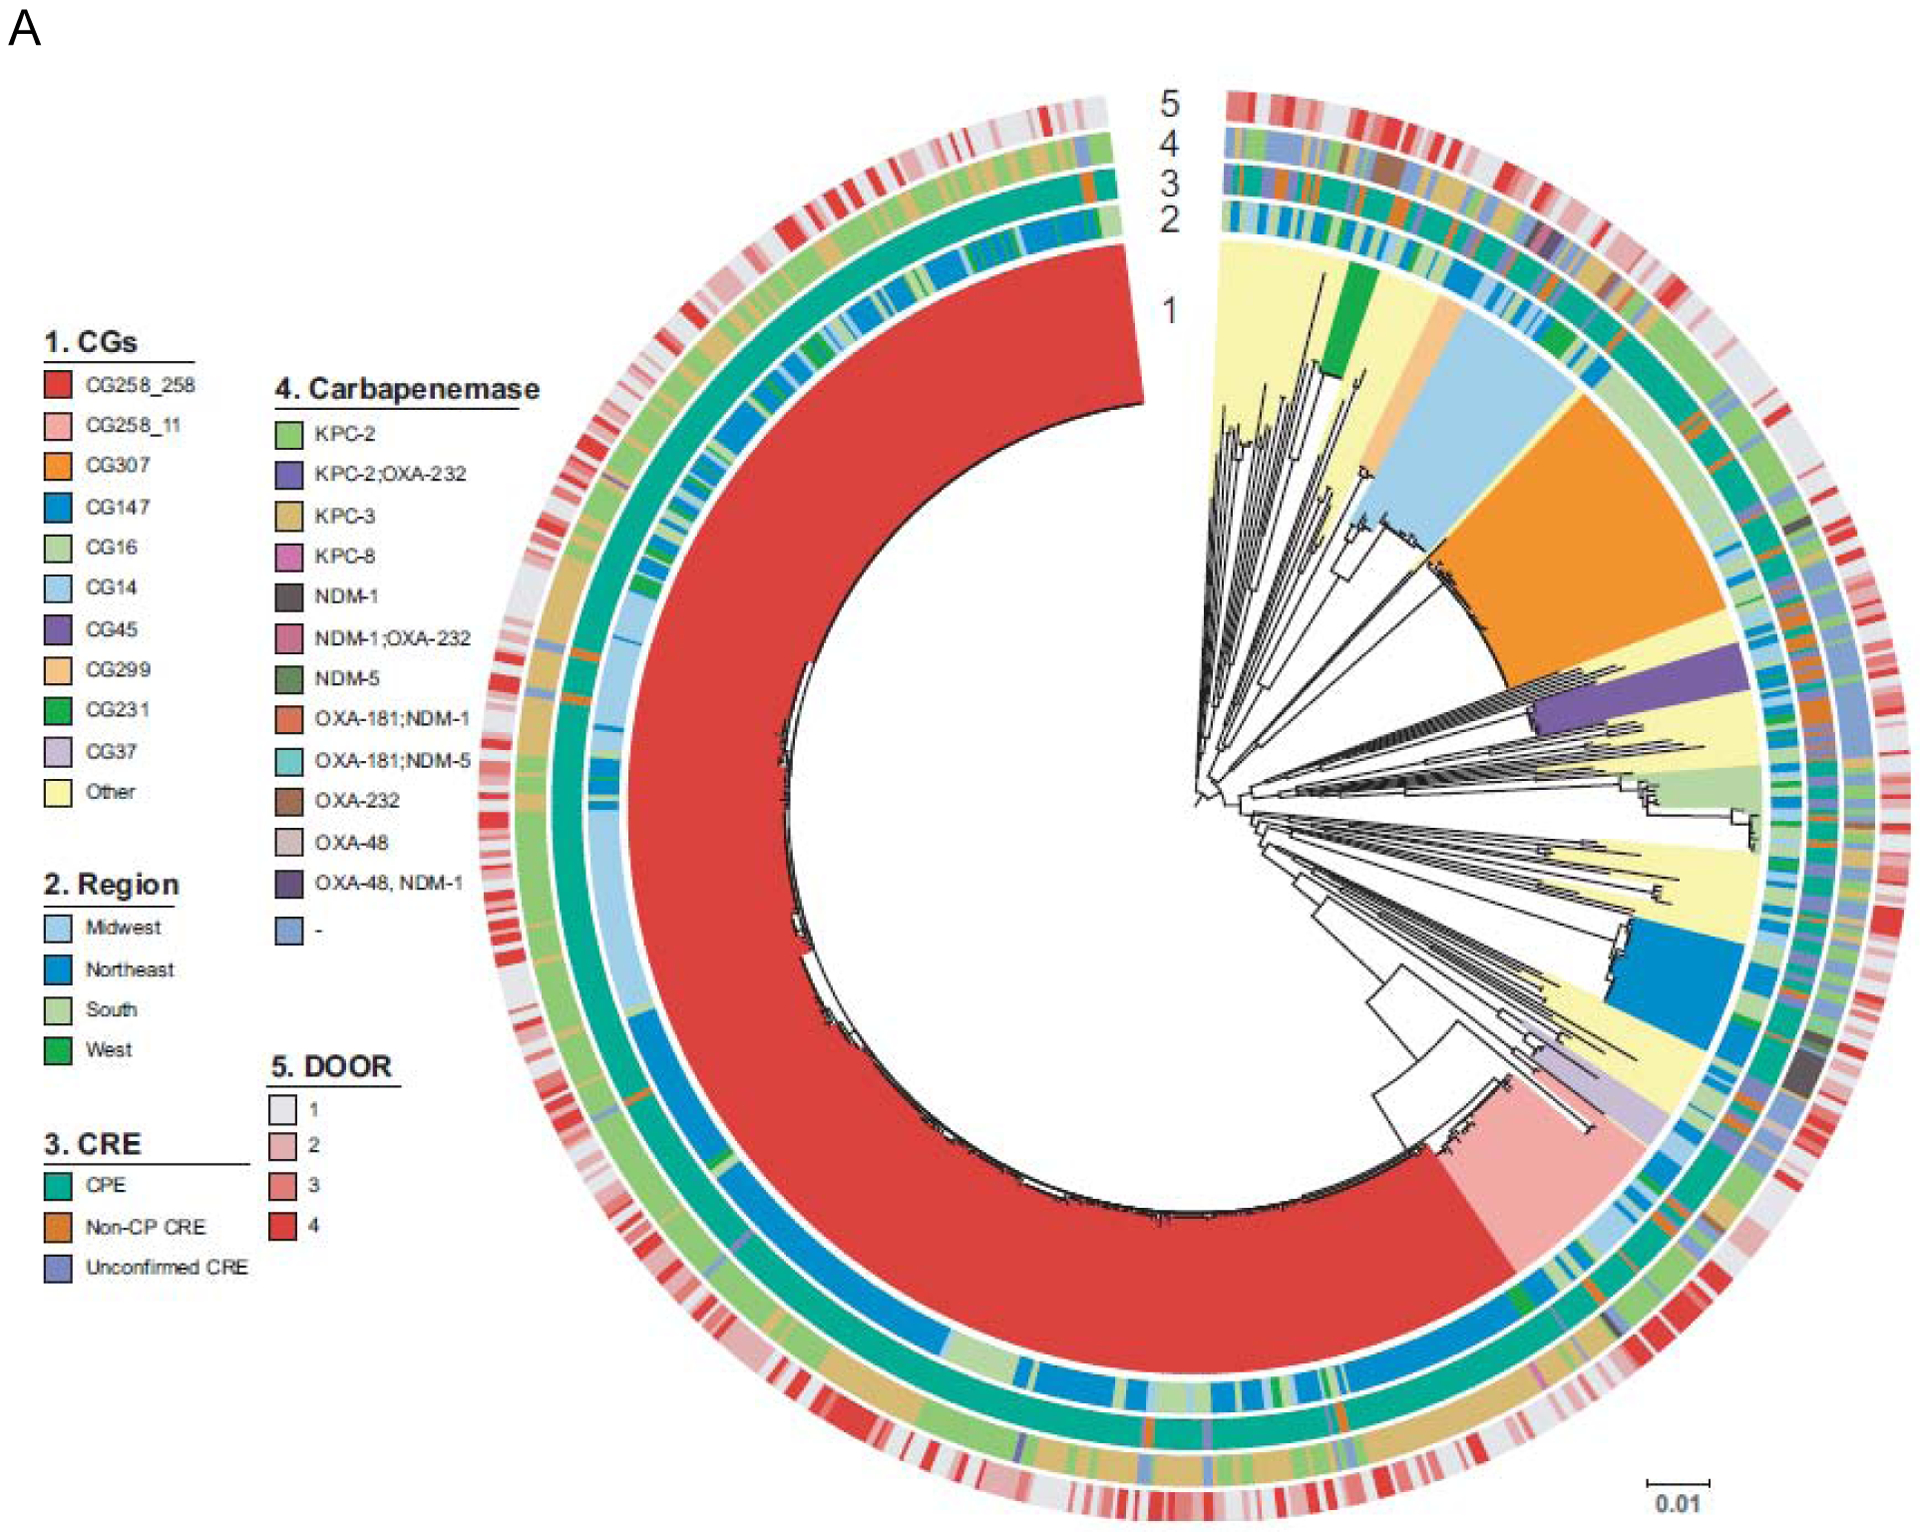
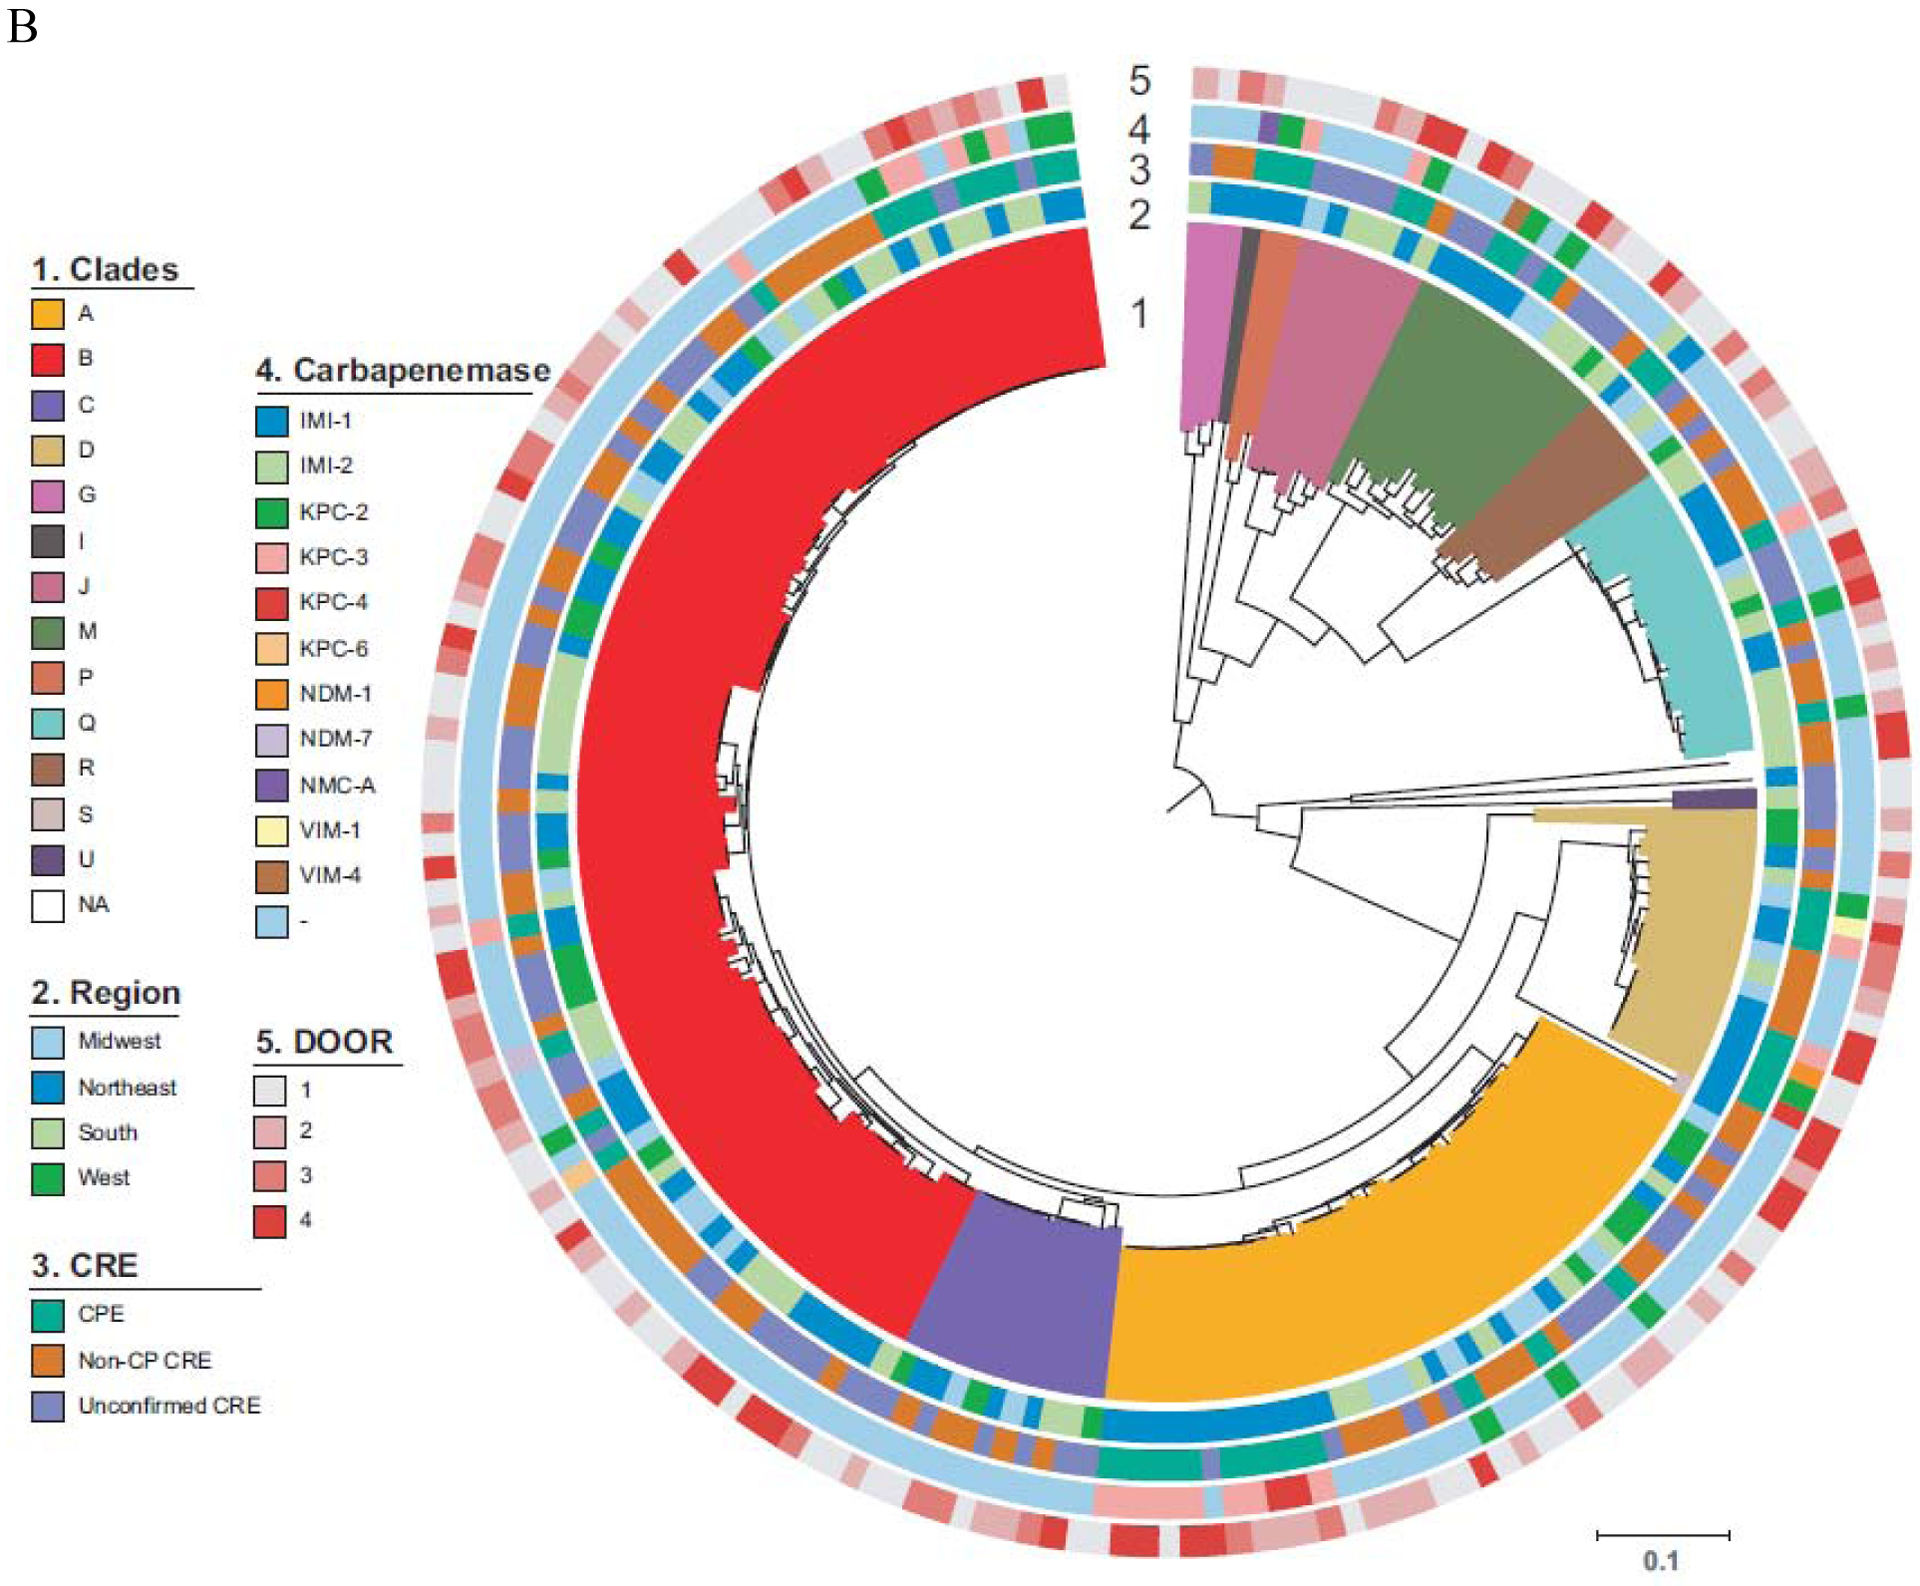
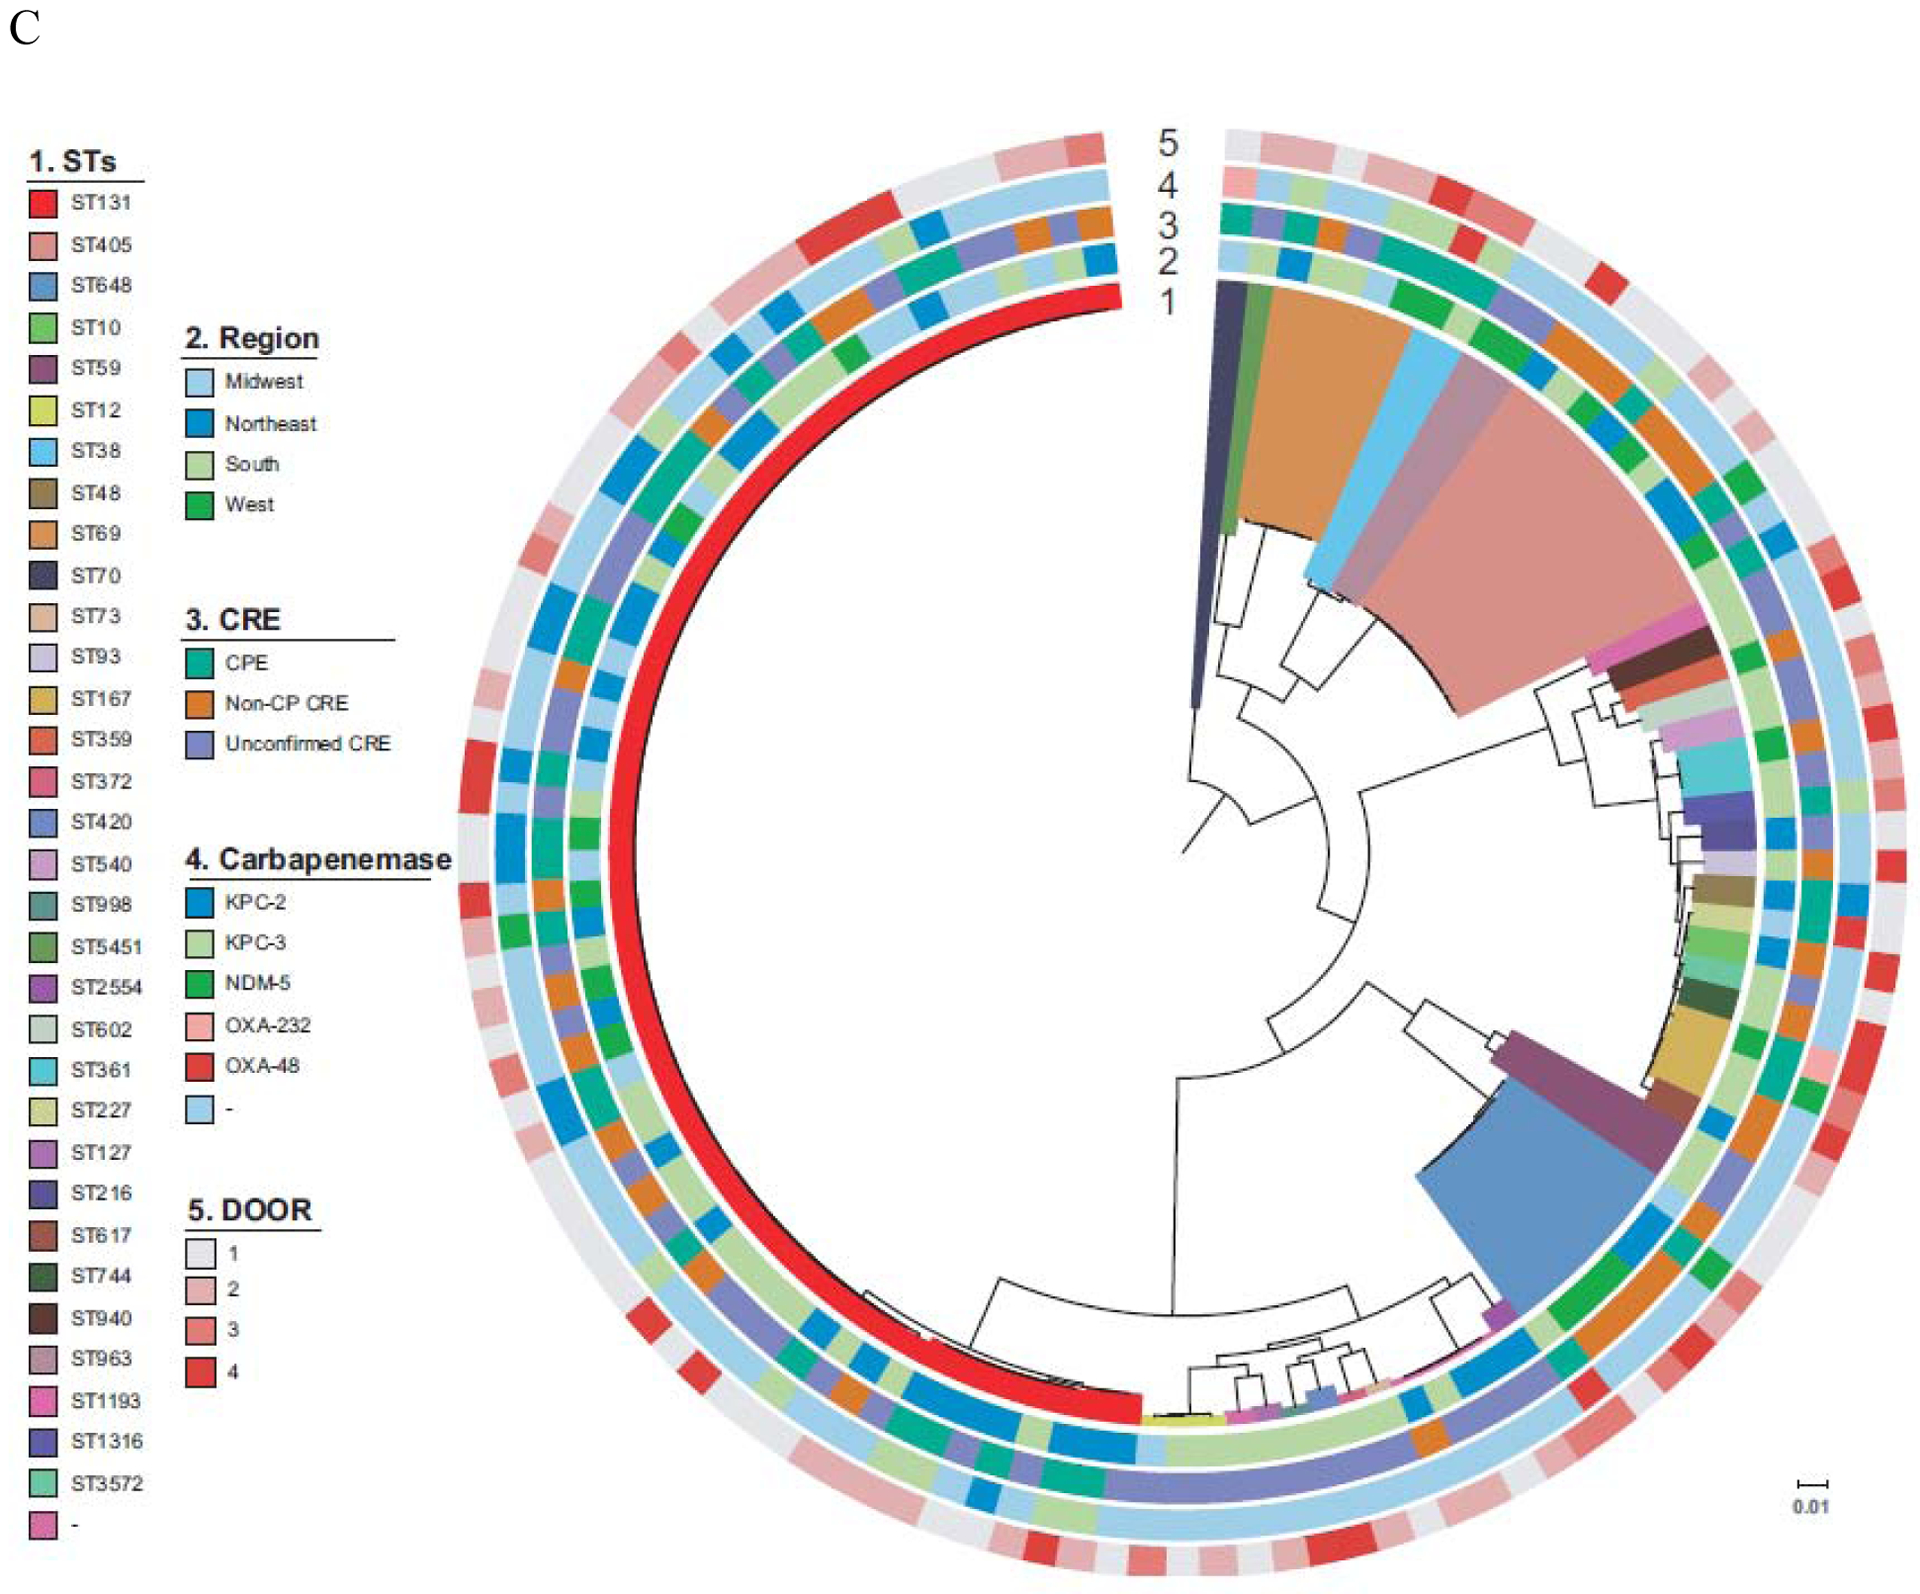
Figure 2. Phylogenetic population structures.


Circle 1 shows clonal groups (CG, 2.A.), Genomic clusters (2.B.), and Sequence Types (ST, 2.C.), Circle 2. indicates region of origin, Circle 3 CPE vs. non-CP-CRE vs. U-CRE, Circle 4 indicates carbapenemase present where applicable and Circle 5 indicates the DOOR level (Level 1; alive without deleterious events. Level 2; alive with 1 deleterious event. Level 3; alive with 2 or 3 deleterious events. Level 4; death). A. K. pneumoniae B. Enterobacter spp. C. E. coli. Of note, an interactive version of this Figure is available online (http://arlg.med.unc.edu/crackle/ password: B@ct3r1@).
